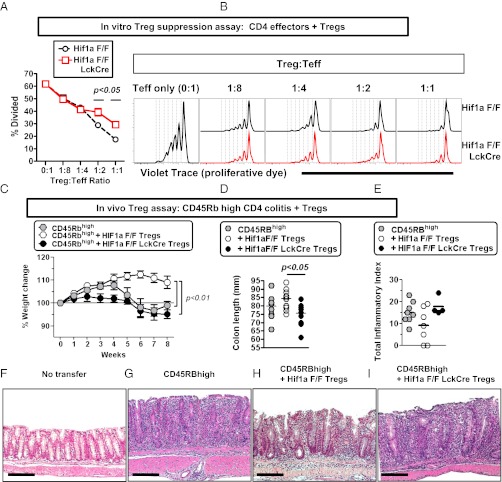
Fig. 7.
Treg-intrinsic HIF-1α is required for optimal Treg suppressive function in vitro and in vivo. (A and B) HIF-1α is required for optimal suppressive function of regulatory T cells in normoxia. Shown is in vitro Treg suppression assay using different ratios of CD4+ CD25+ T cells from Hif1a flox/flox (F/F) or Hif1a flox/flox LckCre+ mice cocultured with Violet Trace-labeled CD4+ CD25− T cells from Hif1a flox/flox mice, irradiated APCs, and soluble anti-CD3 (1 μg/mL). T-cell proliferation was assessed 4 d poststimulation, with data obtained from four independent cultures, with cells isolated from two independent mice. Data depict (A) the percentage of CD4+ CD25− T cells that have undergone at least one round of division, showing mean ± SEM for four independent cultures, and (B) proliferation of CD4+ CD25− T cells as measured by Violet Trace dilution at multiple different ratios of effector T cells to regulatory T cells, with control Treg cultures plotted in black (upper) and Hif1a–deficient Treg cultures plotted in red (lower). Statistically significant differences are indicated, calculated by unpaired t test. (C–I) Rag1−/− mice were adoptively transferred with CD4+ CD45RBhigh cells with or without CD4+ CD25+ Tregs from control mice or mice deficient in Hif1a in T cells (Hif1a F/F LckCre). Progression to colitis was monitored weekly by weight loss (C) or at the time of harvest by measuring colon length (D) or by histological scoring (E). Examples of histology in each of the groups are provided in F–I, corresponding to mice without T-cell transfer (F) or receiving CD45RBhigh cells without Tregs (G), CD45RBhigh cells + control Tregs (H), or CD45RBhigh cells + Hif1a–deficient Tregs (I). Data indicate mean ± SEM (n = 9–13 mice per group), from three independent experiments except for E, which shows data from n = 4–8 mice per group from two independent experiments. For Hif1a genotype, F refers to floxed. (Scale bars in F–I, 200 μm.) Statistically significant differences are indicated, calculated by unpaired t test or by ANOVA with Tukey’s posttest correction.

