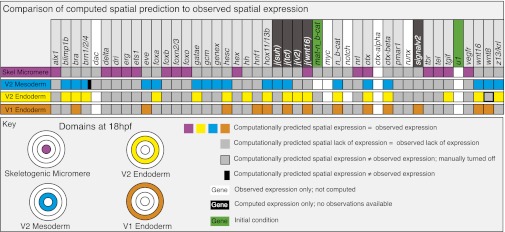
Fig. 2.
Comparison of computed and observed spatial expression patterns. Upper: All regulatory genes included in the model. Experimental expression data are summarized digitally online (http://sugp.caltech.edu/endomes/#BioTapestryViewer). Expression in this chart indicates presence of the computed or observed transcript at any time between 18 and 30 h, except for the V2 mesoderm domain, where the relevant interval is 12 to 16 h (see Computed Spatial Gene Expression above). As indicated in the key, the actual comparison between observed and computed results, i.e., for genes in which both types of data exist, pertains to the colored and gray squares. A discrepancy between computed and observed expression is indicated by a black bar. For genes or regulatory operators shown on black backgrounds, no observational data are available; for genes on white backgrounds, no upstream regulatory information is available, and the activation of these genes was not computed. Where such genes are expressed, or for maternal nuclear β-catenin, in which it is present, the time/space domain is shown in white; where they are observed not to be expressed is shown in gray. The disposition of the four spatial domains in the chart, in embryos viewed from the vegetal pole, is color-coded (Fig. S4 shows a general diagram of embryogenesis).

