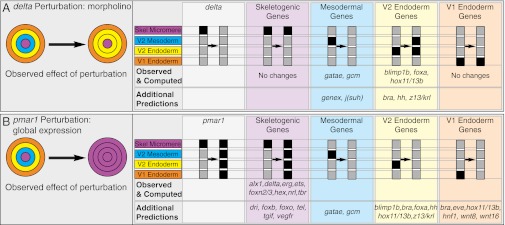
Fig. 4.
In silico perturbation experiments. Left: Experimental perturbation mimicked in the computation and diagram of its general result. The five panels containing gray and black columns (Right) indicate respectively the in silico perturbation and its computational effects in the four embryonic domains. The specific genes affected in the computation are shown below: “Observed & Computed” indicates genes with a comparable experimentally observed change in expression; “Additional Predictions” indicate genes that have not been experimentally studied in these perturbations. (A) Interference with skeletogenic micromere expression of delta and (B) global overexpression of Pmar1. The detailed results as computed for all genes in the model are shown in Fig. S8 A and B.

