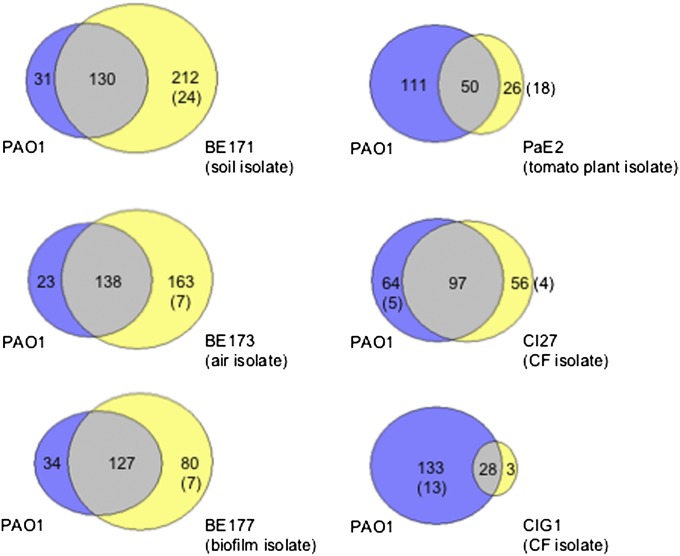
Fig. 2.
Venn diagram showing the relationship between quorum-sensing–controlled genes in P. aeruginosa PAO1 and the environmental and CF isolates. Areas within the Venn diagram are drawn approximately to scale, and the number of genes in each is indicated. The number of genes absent from the other genome is shown in parentheses.

