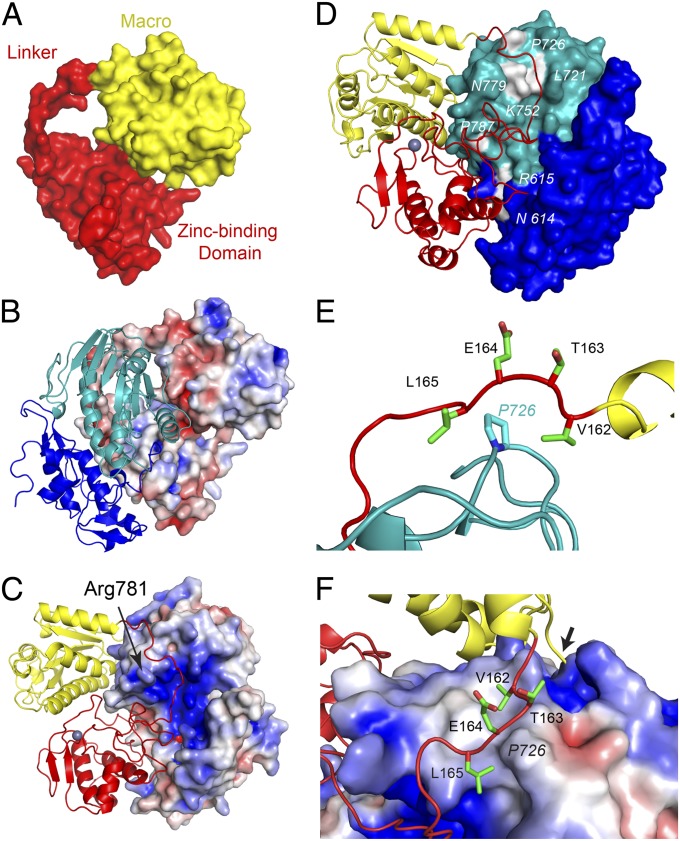
Fig. 2.
nsP2 and nsP3 interface and the location of nsP2 noncytopathic mutants. (A) Solvent-accessible surface of nsP3. (B and C) Surface of nsP3 (B) or nsP2 (C) colored for electrostatic potential at ±5 kT/e; blue (basic), red (acidic), and white (neutral) with ribbon diagram of nsP2 (B) or nsP3 (C). (D) Molecular surface of nsP2 highlighting (white) the location of nsP2 noncytopathic mutations. The numbering corresponds to SINV nsP2 sequence. (E) Location of P726 in nsP2, highlighting interactions with the nsP3 linker. A portion of the last helix in the nsP3 macro domain is shown in yellow. (F) Surface of nsP2 P726 and surrounding area colored for electrostatic potential at ±4 kT/e with nsP3 linker region in stick format. Residues labeled in italics are located in nsP2. Arrow indicates P2/3 cleavage site. Domain coloring in each panel is identical to Fig. 1.

