
Fig. 2.
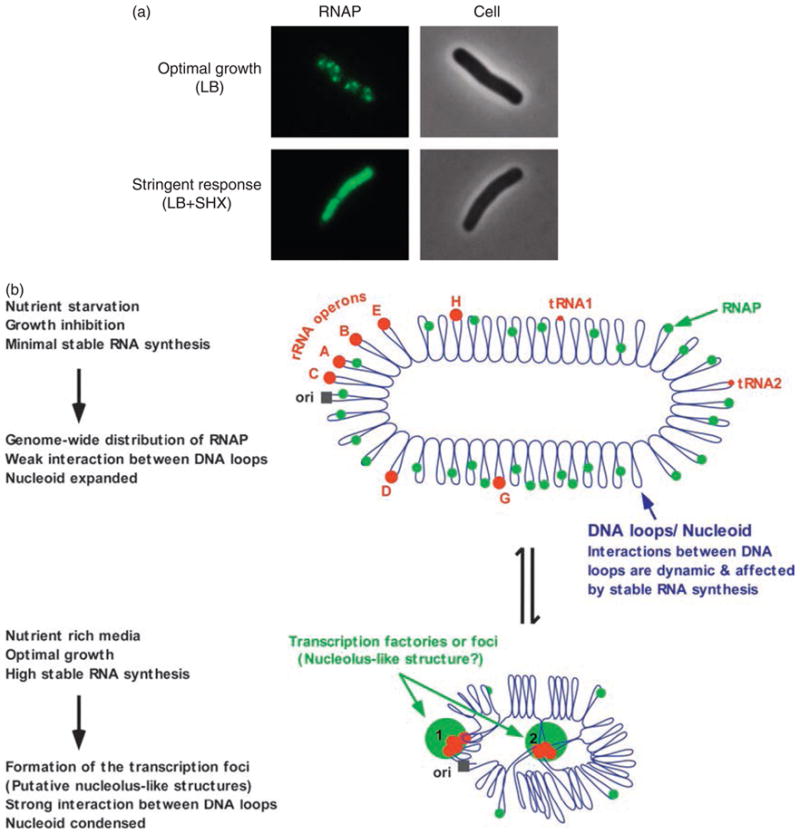
(a) The distribution of RNAP is sensitive to environmental cues. During optimal growth, concentrated RNAP (pseudo-colored green) forms dominant transcription foci, which are proposed to be special transcription factories and the nucleolus-like structures, where rRNA is being actively synthesized, in a mid-log cell grown in nutrient rich LB. With the addition of serine hydroxamate (SHX), which caused cell starvation for amino acid and induced the stringent response, RNAP is redistributed relatively homogeneously in the nucleoids. The RNAP is fused with a fluorescent protein and imaged with a fluorescent microscope with the corresponding cells in phase contrast as described (Cabrera & Jin, 2003). (b) Model illustrating the dynamics of the transcription factories or foci and the putative nucleolus-like structures under the two extreme growth conditions. The Escherichia coli chromosome is represented as blue lines folded in loops, the ori of replication as a black square, the seven rRNA operons as large red circles with letters, and two representative tRNA operons as small red circles. The RNAP molecules are represented as small green circles. For simplicity, during optimal growth only two transcription factories/foci and putative nucleolus-like structures, which make the nucleoid more compact by pulling different stable RNA operons into proximity, are indicated (bottom part of the diagram, large green circles encompassing multiple large red cycles labeled 1 and 2) (Adapted from the study by Cabrera & Jin, 2003).