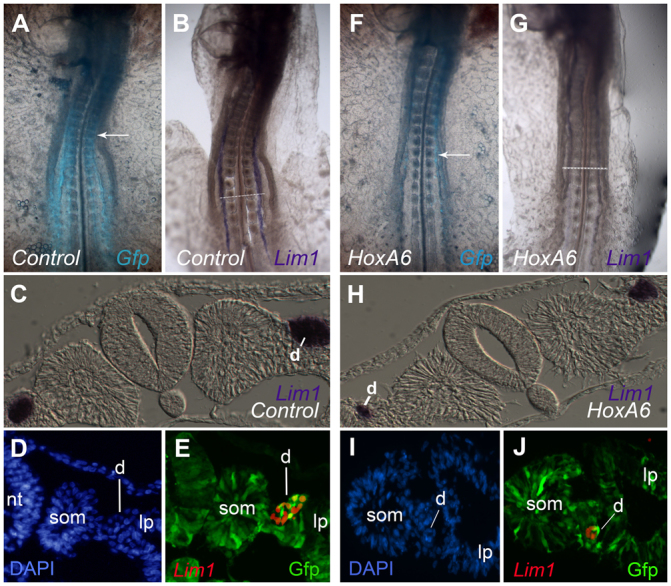
Fig. 7.

HoxA6 misexpression represses nephric duct formation. (A-J) Embryos were electroporated with an empty pMes-GFP vector (A-E) or pMes-HoxA6-GFP expression vector (F-J) and analyzed by whole-mount in situ hybridization for Lim1 (B,C,G,H) or by immunofluorescence for Lim1 and Gfp (D,E,I,J). In HoxA6-electroporated embryos, Lim1 expression was weaker than controls (compare B with G) and the nephric duct was typically smaller (compare C with H). When analyzed by immunofluorescence, GFP-expressing cells (indicative of electroporation) were found with lower frequency in the nephric duct of HoxA6-electroporated embryos (I,J) when compared with controls (D,E), despite the fact that they are abundant in the surrounding tissues in both situations. Arrows indicate somite 10. d, nephric duct; lp, lateral plate; nt, neural tube; som, somite.
