Fig. 5.
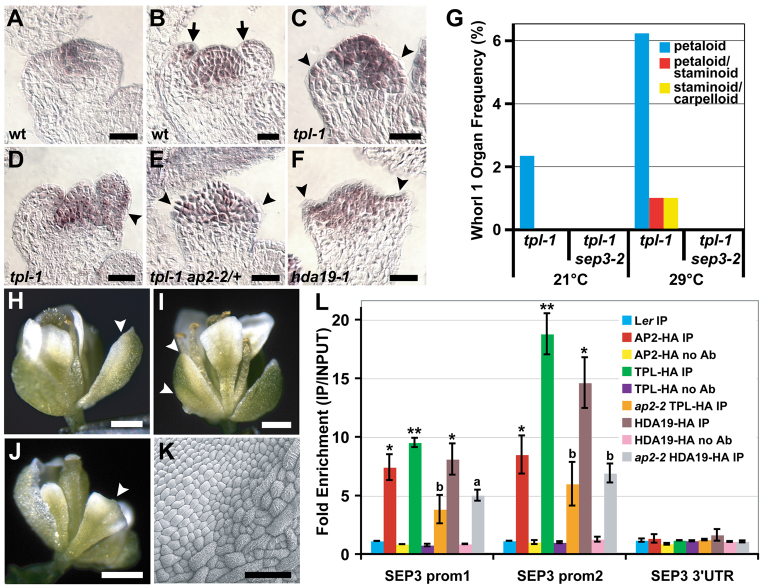
The E-class gene SEP3 is repressed in whorl 1 organ primordia by AP2, TPL and HDA19. (A-F) SEP3 in situ hybridizations on stage 3 (A,C,E,F) and stage 4 (B,D) Arabidopsis flowers. (A) SEP3 is not expressed in newly initiated outer whorl organ primordia in wild type. (B) By stage 4, SEP3 expression is detectable in wild-type sepals, but only at the distal tips of the organs (arrows). (C,E,F) SEP3 is ectopically expressed in mutant outer whorl organ primordia (arrowheads). (D) Sepal of a stage 4 tpl-1 flower showing an expanded SEP3 expression domain (arrowhead). (G) sep3-2 suppresses whorl 1 homeotic conversions of tpl-1 at 21°C and 29°C. (H-J) 2x35Sp::SEP3 flowers with sepals exhibiting petal identity (arrowheads) on one margin (H), both margins (I) or throughout the entire organ (J). (K) Scanning electron micrograph of a mosaic 2x35Sp::SEP3 sepal with ectopic petal epidermal identity (upper left; compare with Fig. 3E,F). (L) Anti-HA ChIP showing binding of AP2, TPL and HDA19 to two regions of the SEP3 promoter. Control ChIPs were performed on non-transgenic wild-type tissue (Ler) or without antibody (no Ab). Data were normalized relative to input and ACT2 abundance. Data are represented as mean ± s.e.m. of at least two biological replicates. Student's t-test was used to determine the significance of target enrichment relative to Ler IP (*P≤0.05, **P≤0.005) and the significance of decreased binding in ap2-2 (a, P≤0.08; b, P≤0.05). Scale bars: 20 μm in A-F; 500 μm in H-J; 50 μm in K.

