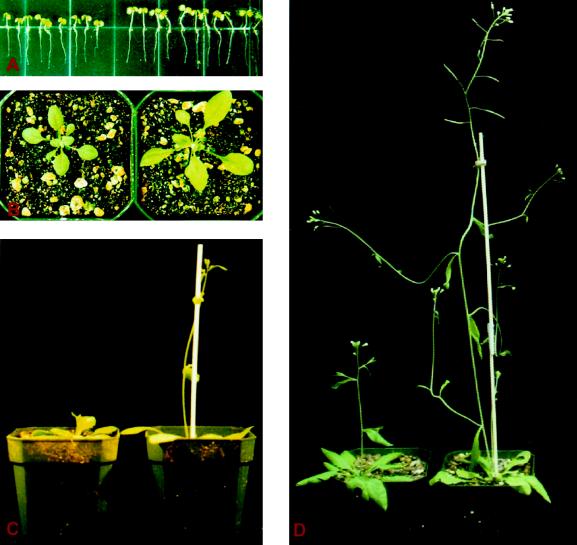
Figure 2.
Promoted growth of 20-oxidase-overexpressing plants. The pictures compare the growth of transgenic (right) and wild-type (left) plants at 1 week (A), 3 weeks (B), 3.5 weeks (C), and 4 weeks of age (D). The plants shown are from the T3 generation of transgenic line 25-2. The transgenic plants are homozygous for the transgene and the wild-type plants are their nontransgenic siblings.

