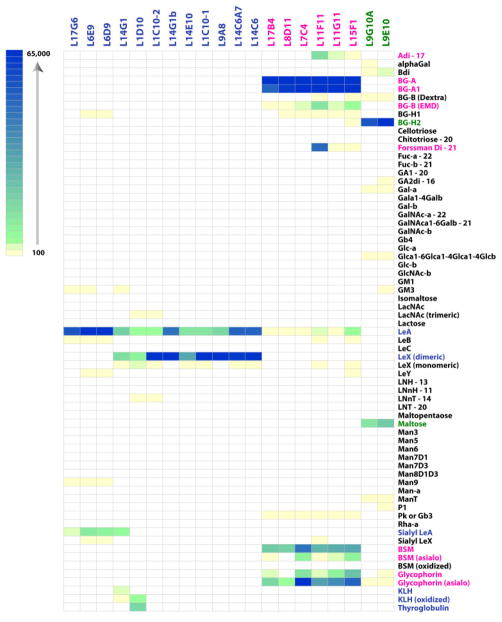
Figure 3.
Heat Map of Binding Profiles for the 20 Glycan-Binding Antibodies. Data for each antibody is shown in columns. Data for each glycan is shown in rows. Colored boxes correspond to the raw fluorescence units for a given glycan; white boxes indicate no significant signal above the background (signal ≤ 3x the background). Only a subset of the array components is shown (for a full list and complete data, see the Supporting Information). Antibodies have been grouped by family. Glycans are listed alphabetically with the glycoproteins listed at the bottom LeX/LeA/SLeA binders and the corresponding glycans are shown in blue font; BG-A/A1 binders and the corresponding glycans are shown in pink font; and BG-H2 binders and the corresponding glycans are shown in green font.

