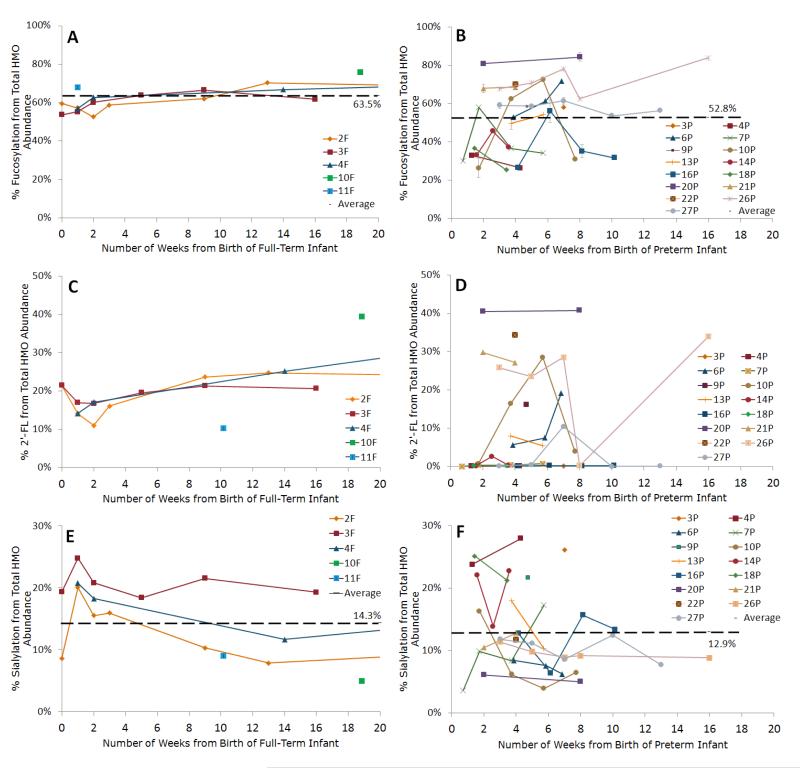
Figure 2.
Line graphs of the percent fucosylation of human milk oligosaccharides (HMOs) in (A) term and (B) preterm milk during the course of lactation; percent abundance of 2′ fucosyllactose, an HMO containing an α 1,2 fucose in (C) term and (D) preterm milk; and percent sialylation of HMOs in (E) term and (F) preterm milk. Y values are expressed as percentage from the total HMO abundance normalized per sample. Each color represents a different mother. Averages are shown as black broken lines. Average percent values for preterm milk shown in B, D, and F include all preterm milk samples (N=41) listed in Table 1. Average percent values for term milk shown in A, C, and E include all term milk samples (N=23) listed in Table 2. Error bars are expressed as standard error of the mean (SEM).

