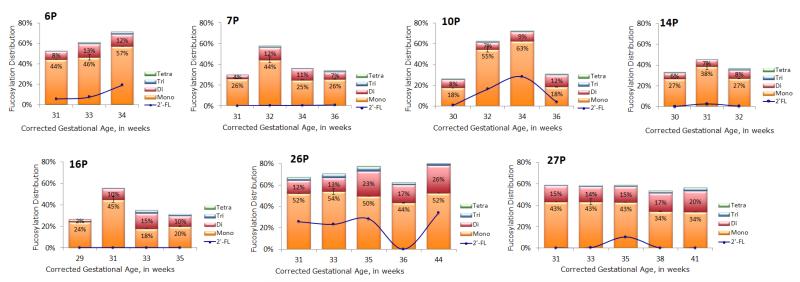
Figure 4.
Bar graphs of mono, di, tri and tetrafucosylation of free HMOs in human milk of seven mothers who delivered prematurely. The line graph inset in each bar graph is the percent abundance of 2′ fucosyllactose present in the sample. Only mothers who had three or more samples were graphed. The height of each bar represents the total fucosylation in the sample. Error bars are expressed as standard error of the mean (SEM).

