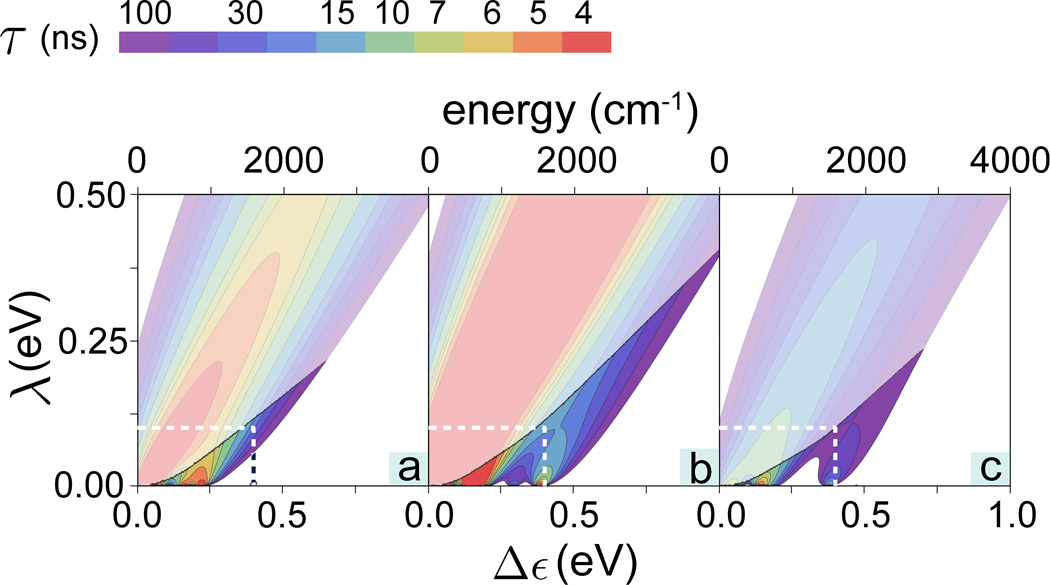
Figure 3. Electron tunneling rates in an olfactory receptor.
Contour plots showing the calculated electron tunneling rates as a function of energy difference Δε and reorganization energy λ for (a) acetophenone, (b) citronellyl nitrile and (c) octanol. For convenience the color-code indicates the characteristic tunneling times of the electron in the receptor, i.e., the inverse of the tunneling rate. The endashed rates are shown in Fig. 4 in greater detail. The faded colors indicate regions where the inelastic tunneling rate 1/τ falls below the elastic tunneling rates, 1/τ0.

