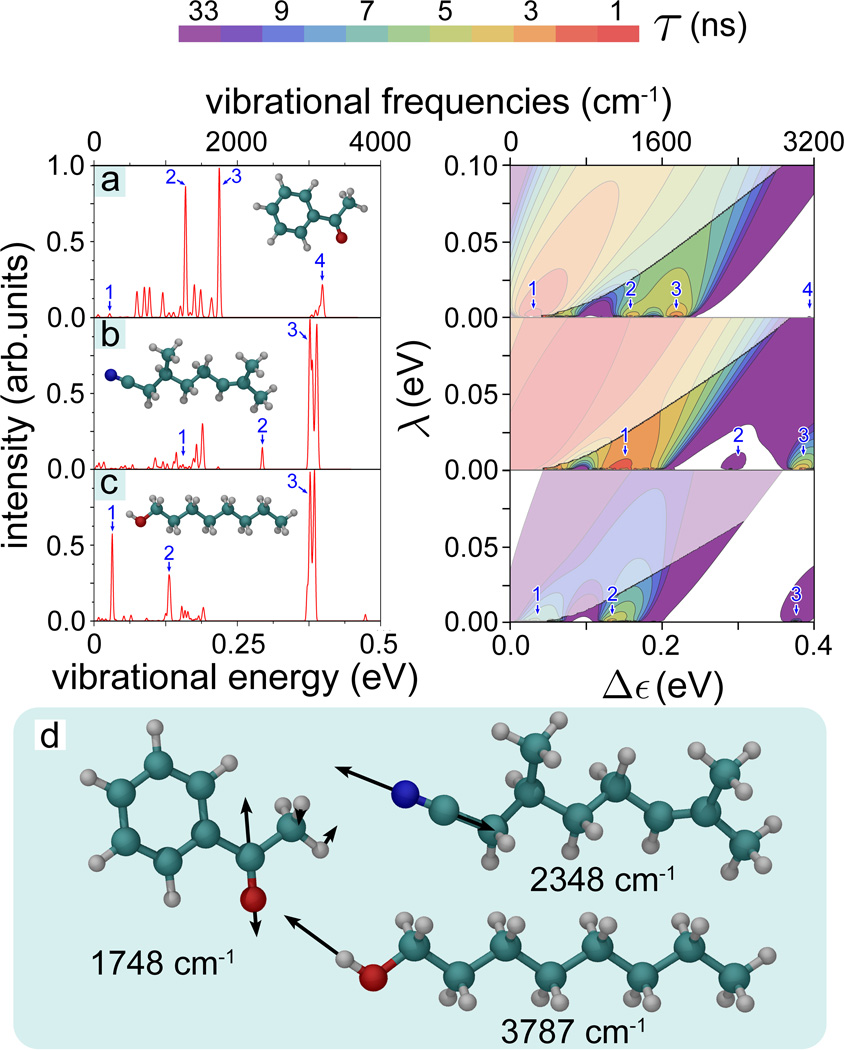
Figure 4. IR spectra and electron tunneling rates.
(Right) Contour plots of the calculated electron tunneling rates shown as a function of the energy difference 0 ≤ Δε ≤ 0.4 eV and reorganization energy 0 ≤ λ ≤ 0.1 eV for (a) acetophenone, (b) citronellyl nitrile and (c) octanol. The rates shown are taken from Fig. 3. For convenience the color-code indicates the characteristic tunneling times of the electron in the receptor, i.e., the inverse of the tunneling rate. The faded colors indicate regions where the inelastic tunneling rate 1/τ falls below the elastic tunneling rates 1/τ0. (Left) Calculated normalized IR spectra for the three odorants with structures shown in the insets. Numbers 1, 2, 3, 4 label in the left and right panels corresponding IR vibrations. (d) Illustrative high-frequency vibrations in acetophenone, citronellyl nitrile and octanol involving odorant side-groups. The vibrational energies are indicated below the corresponding odorant molecule.

