Figure 2.
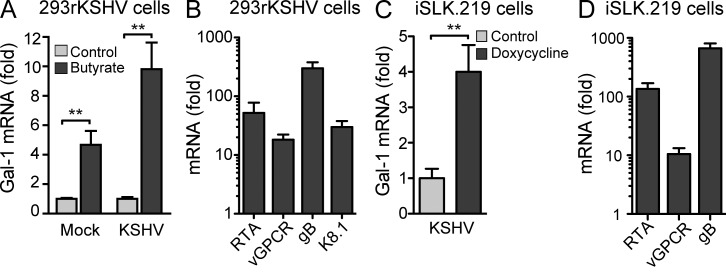
KSHV controls Gal-1 expression. (A) qRT-PCR analysis of Gal-1 mRNA in uninfected 293 and 293rKSHV.219 cells upon stimulation with 3 mM sodium butyrate to induce lytic gene expression. Data indicate fold increase of mRNA as measured by triplicates of two independent experiments. (B) KSHV lytic gene expression (RTA, vGPCR, gB, K8.1) in 293rKSHV cells upon stimulation with sodium butyrate for 24 h. Data indicate fold increase of mRNA as measured by triplicates of two independent experiments. (C) qRT-PCR analysis of Gal-1 mRNA in iSLK.219 cells upon stimulation with doxycycline to induce RTA-driven lytic gene expression. Data indicate fold increase of mRNA as measured by triplicates of two independent experiments. (D) KSHV lytic gene expression (RTA, vGPCR, gB) in iSLK.219 cells upon stimulation with doxycycline. Data indicate fold increase of mRNA as measured by triplicates of two independent experiments. (A–D) Error bars represent SEM. (A and C) **, P < 0.01.

