Figure 7.
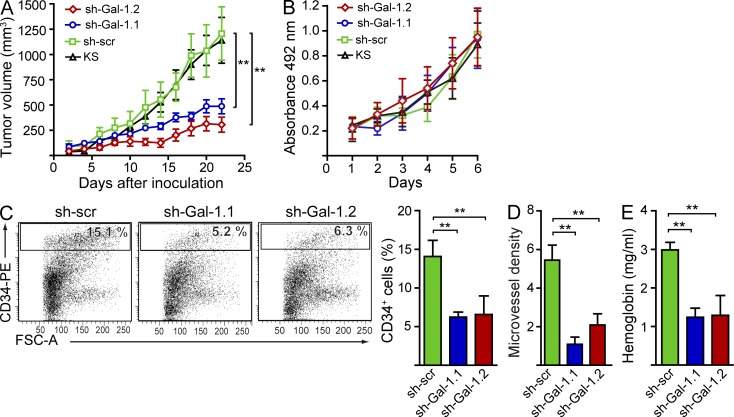
Targeting Gal-1–glycan interactions prevents the angiogenic switch in KS. (A) Tumor growth in nude mice inoculated with 5 × 10⁶ knockdown KS cells expressing Gal-1 shRNA (sh-Gal-1.1 and sh-Gal-1.2), KS cells expressing scr shRNA (sh-scr), or nontransfected KS cells (KS). Data are the mean ± SEM of four independent experiments with five animals per group. (B) In vitro cell growth of KS clones expressing Gal-1 shRNA or scr shRNA (sh-scr) or nontransfected KS cells (KS). Data are the mean ± SEM of three independent experiments. (C) Flow cytometry of tumor-associated CD34+ ECs. Dot plots are representative of four independent experiments. Right, data are the mean ± SEM of four independent experiments. (D) Microvessel density. Data are the mean ± SEM of four independent experiments. (E) Tumor hemoglobin content. Data are the mean ± SEM of four independent experiments. (A and C–E) **, P < 0.01.

