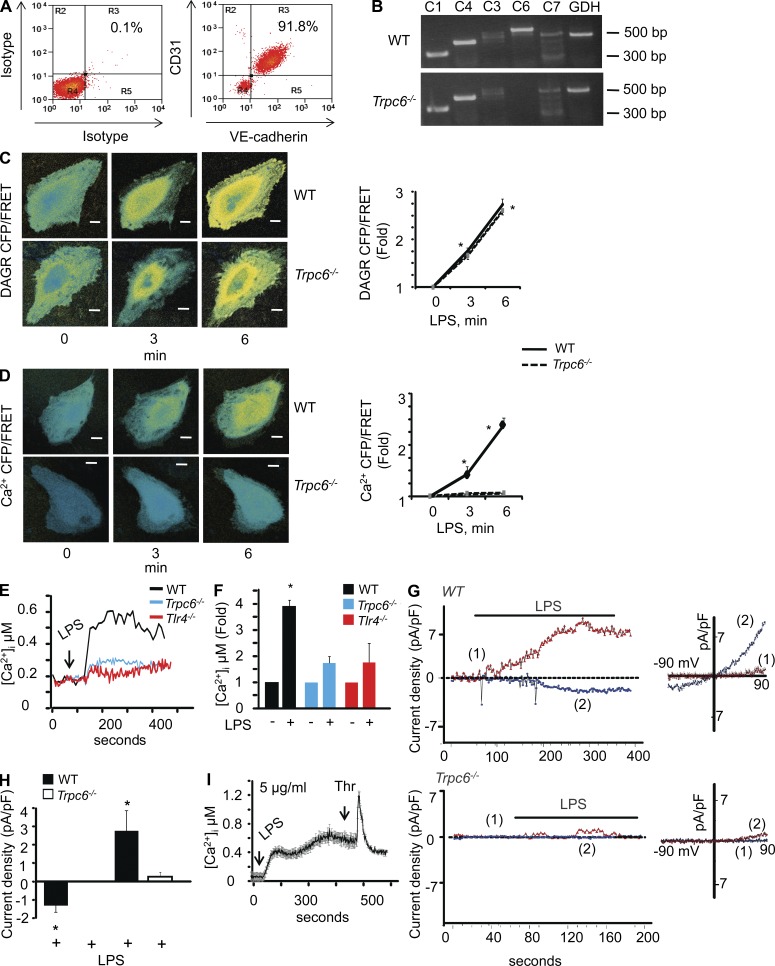
Figure 1.
LPS-generated DAG induces Ca2+ entry and activates Ca2+ current in lung ECs in a TRPC6-dependent manner. (A) Dot plot analysis of EC surface markers was performed with WT-MLECs immunostained with APC-tagged VE-cadherin and PE-tagged CD31. WT-MLECs immunostained with APC-IgG and PE-IgG were used as isotype controls. Data are representative of at least two independent experiments. (B) RNA extracted from WT and Trpc6−/− MLECs were reverse-transcribed using suitable primers, as described in the Materials and methods. GAPDH was used as internal control. C1, C4, C3, C6, C7, and GDH represent TRPC1, TRPC4, TRPC3, TRPC6, TRPC7, and GAPDH, respectively. (C and D) WT or TRPC6−/− MLECs were transduced with FRET-based DAG reporter (DAGR; C) or Ca2+ reporter (D). Cells were then stimulated with 1 µg/ml LPS and dynamic changes in CFP, FRET, and YFP were acquired. DAG and Ca2+ reporter activities were calculated by ratioing CFP/FRET intensity before and after stimulation with LPS (left). Plot shows mean ± SEM from three individual experiments (right). * indicates a significant increase in reporter activity over time zero (P < 0.05). Bars, 5 µm. (E and F) WT, Trpc6−/−, or Tlr4−/− MLECs loaded with Fura 2-AM for 25 min were stimulated with 1 µg/ml LPS and Fura 2 at a ratio of 340:380 was recorded. Intracellular Ca2+ concentrations were then calculated as described in Materials and methods. Representative traces show a mean Ca2+ response of 20–25 WT, Trpc6−/−, or Tlr4−/− ECs in a given field (E). Plot shows mean ± SEM of changes in intracellular Ca2+ concentration after (+) stimulation of MLECs with LPS from 2–3 independent experiments (F). * indicates an increase in intracellular Ca2+ after addition of LPS (P < 0.05). (G, left) Representative traces of LPS-elicited, leak-subtracted currents obtained during voltage ramps from −90 mV to + 90 mV in a WT MLEC (top) and a Trpc6−/− MLEC (bottom). Circles indicate current densities at −90 mV, whereas the triangles show current densities at +90 mV. The holding potential was −60 mV. Horizontal bars indicate times when LPS was added to the bath. (right) Current-voltage relationships obtained during ramps from −90 mV to 90 mV at times indicated with (1) and (2) in a WT and TRPC6−/− MLECs. (H) Plot shows mean peak current densities of LPS-elicited currents obtained at a holding potential of −90 mV from 7 wild type and 5 Trpc6−/− MLECs. * indicates significant increase in current after addition of LPS (P < 0.05). (I) WT-MLECs loaded with Fura 2-AM for 25 min were stimulated with 5 µg/ml LPS, and Fura 2 ratio at 340:380 was recorded. Intracellular Ca2+ concentration were then calculated as described in Materials and methods. Representative trace shows mean Ca2+ response of 20–25 MLECs to 50 nM thrombin after LPS stimulation (5 µg/ml). Experiments were repeated at least three times.

