Figure 1.
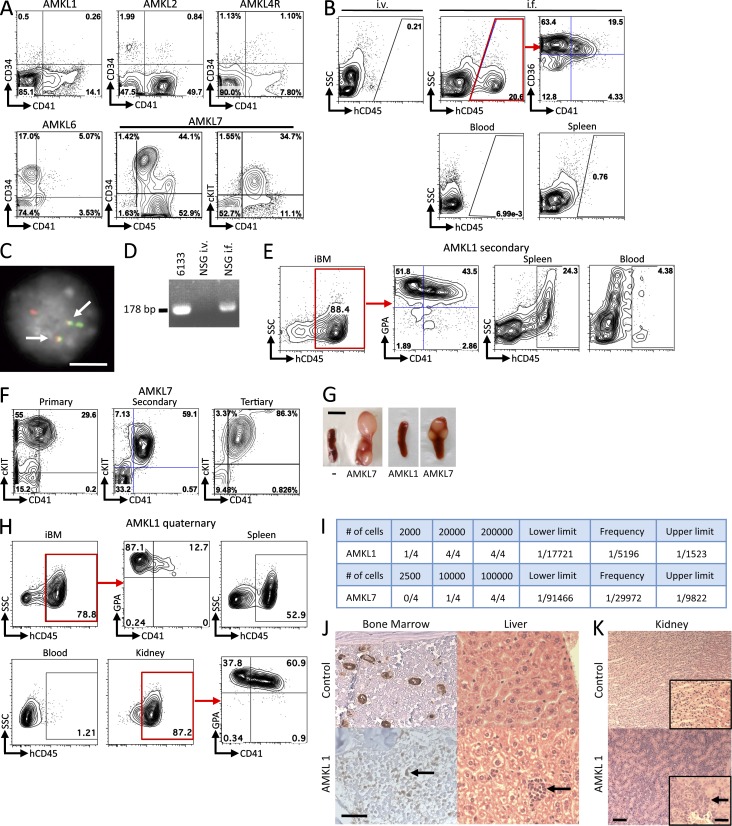
Engraftment of human AMKL samples into NSG recipients. (A) Immunophenotype of patient cells at diagnosis. (B) Flow cytometry analysis of blood and BM samples from recipients 6 wk after injection of 106 AMKL1 patient cells. Cells were injected either i.v. or i.f. An antibody against the human CD45 marker was used to specifically detect human cells in BM (top), blood, and spleen from recipients. (C) FISH analysis of leukemic cells collected from primary NSG recipients engrafted with AMKL1 patient cells using probes overlapping the OTT (green) and MAL (red) loci. Note the leukemic cells present: one normal OTT signal, one normal MAL signal, and two split signals indicative of a balanced translocation. Arrows point to fusion signals. (D) RT-PCR analysis of RNA from BM cells collected from primary NSG recipients engrafted with AMKL1 patient cells to detect an OTT-MAL fusion transcript. RNA from 6133, a cell line expressing the OTT-MAL fusion, was used as a positive control. (E) Immunophenotype of AMKL1 secondary NSG recipients 6 wk after injection with 0.5 × 10⁶ patient cells. (F) Immunophenotype of AMKL7 patient cells from primary, secondary, and tertiary NSG recipients 6 wk after injection. (G) Consistent splenomegaly with nodular infiltration in AMKL7 recipients is not observed with other AMKL samples including AMKL1. “−“ is a noninjected control NSG mouse. (H) 0.5 × 10⁶ cells from tertiary NSG recipients (AMKL1) were injected i.f. into quaternary recipients. Immunophenotype of injected BM (iBM), spleen, blood, and kidney cells at end point. (I) Human CD45+ cells were purified by flow cytometry from AMKL1 and AMKL7 secondary NSG recipients and injected at different doses in NSG recipients. After 4 wk, BM sampling and flow cytometry were performed. Recipients presenting a percentage of human cells (hCD45+) >0.1% were considered positive. The frequency of leukemia-propagating cells and the lower and upper limits were calculated using the L-Calc software with a 95% confidence interval. (J) Histopathological analysis of BM (left: von Willebrand immunohistochemistry; arrow points to an immature blast showing a low staining with von Willebrand marker) and liver (right: hematoxylin and eosin staining; arrow points to a focal infiltration of blasts) from AMKL1 recipients (bottom) and noninjected control NSG mouse (top). (K) Histopathological analysis of kidney from control and AMKL1 quaternary recipients (arrow points to infiltrated blasts). Insets show a higher magnification of the same section. Bars: (C) 10 µm; (G) 5 mm; (K) 200 µm; (J and K [insets]) 100 µm.

