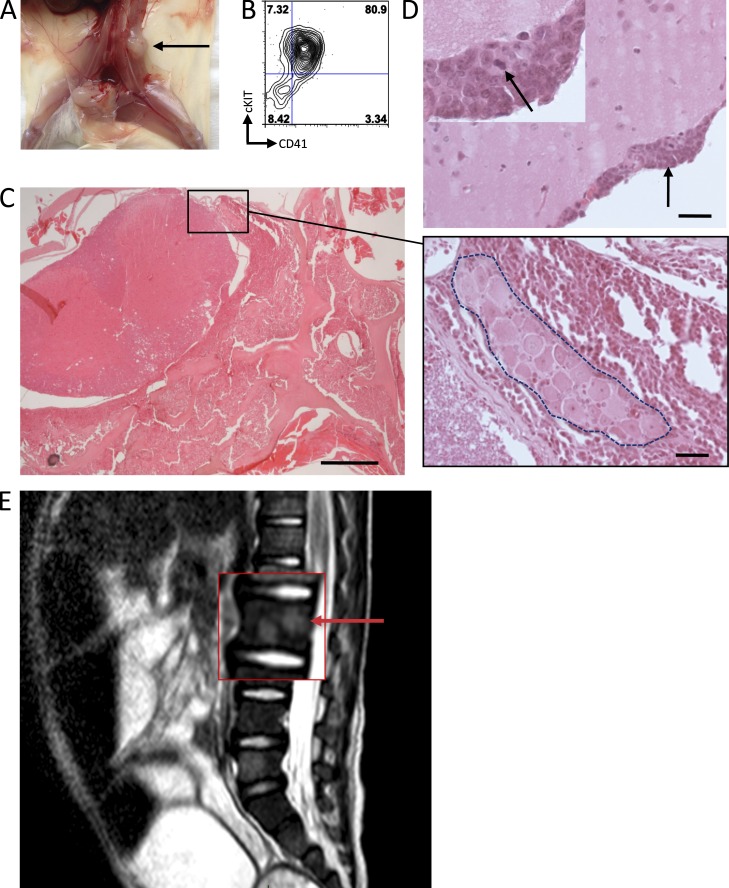
Figure 2.
CNS involvement in AMKL. (A) Recipient from AMKL7 cells showing spinal cord–localized tumor indicated by an arrow. (B) FACS analysis of the spinal cord tumor shown in A indicates that it is constituted of megakaryoblastic cells. (C) Histopathological analysis of the spinal cord. Close-up shows a spinal ganglion (inside dashed area) surrounded by leukemic cells. (D) Histopathological analysis of the brain reveals infiltration of the leptomeninges with leukemic cells. Arrow in the main image points to an infiltration of leukemic cells also shown in the top left inset; arrow in the inset points to a cell in mitosis. Bars: (C, left) 5,000 µm; (C [right] and D) 50 µm. (E) MRI image of the AMKL7 patient showing abnormal signals in several spine areas, suggesting leukemia infiltration of the nervous system. Arrow points to an abnormal signal.

