Figure 4.
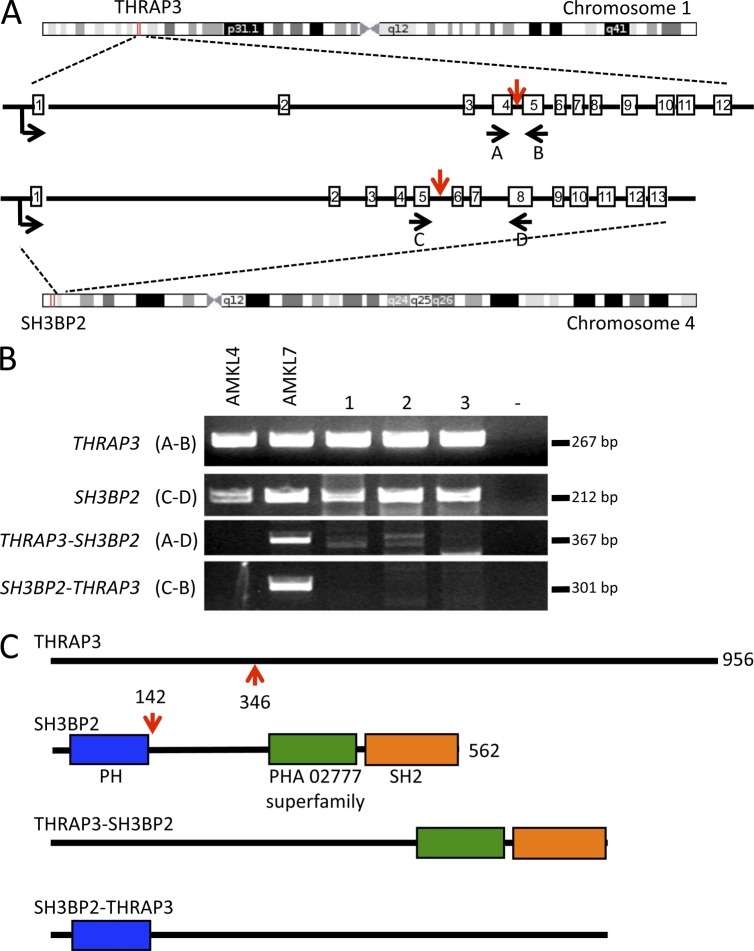
The THRAP3-SH3BP2 fusion. (A) Schematic representation of the fusion between THRAP3 (located on chromosome 1) and SH3BP2 (located on chromosome 4). Localization on chromosome and exon–intron gene structure are indicated. Red vertical arrows indicate the targeted introns. Horizontal black arrows indicate localization of the primers used for RT-PCR analysis described in B to detect the fusion transcripts. (B) RT-PCR analysis on a validation cohort of AMKL patients using the primers described in A. Bands appearing in samples 1, 2, and 3 for the THRAP-SH3BP2 fusion were not confirmed by direct sequencing and therefore represent nonspecific amplification. (C) Schematic representation of the THRAP3, SH3BP2, THRAP3-SH3BP2, and SH3BP2-THRAP3 predicted proteins. Red arrows indicate fusion points on each protein.

