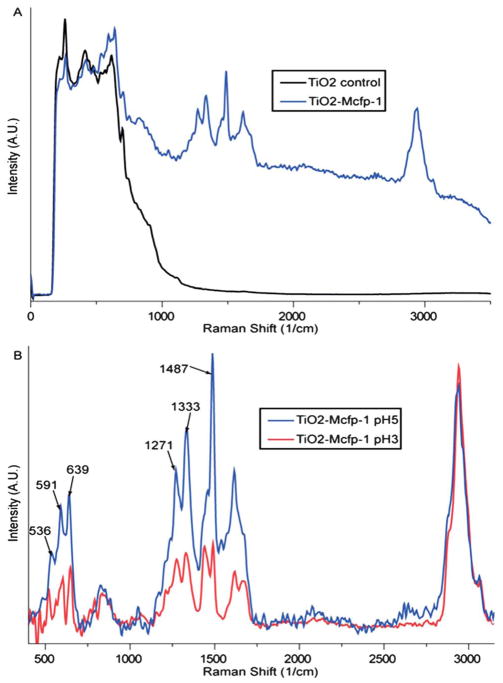
Fig. 3.
Resonance Raman spectra of DOPA–TiO2 interactions. (A) Raman spectra of mica coated with amorphous TiO2 before (black line) and after (blue line) incubation with mcfp-1. (B) Background-subtracted spectra of DOPA–TiO2 resonance for samples incubated at pH 5.0 (blue line) and pH 3.0 (red line). Resonance is reduced at lower pH relative to the non-resonant CH vibrational peak (2800–3100 cm−1), but peaks signifying bidentate chelation are still apparent.

