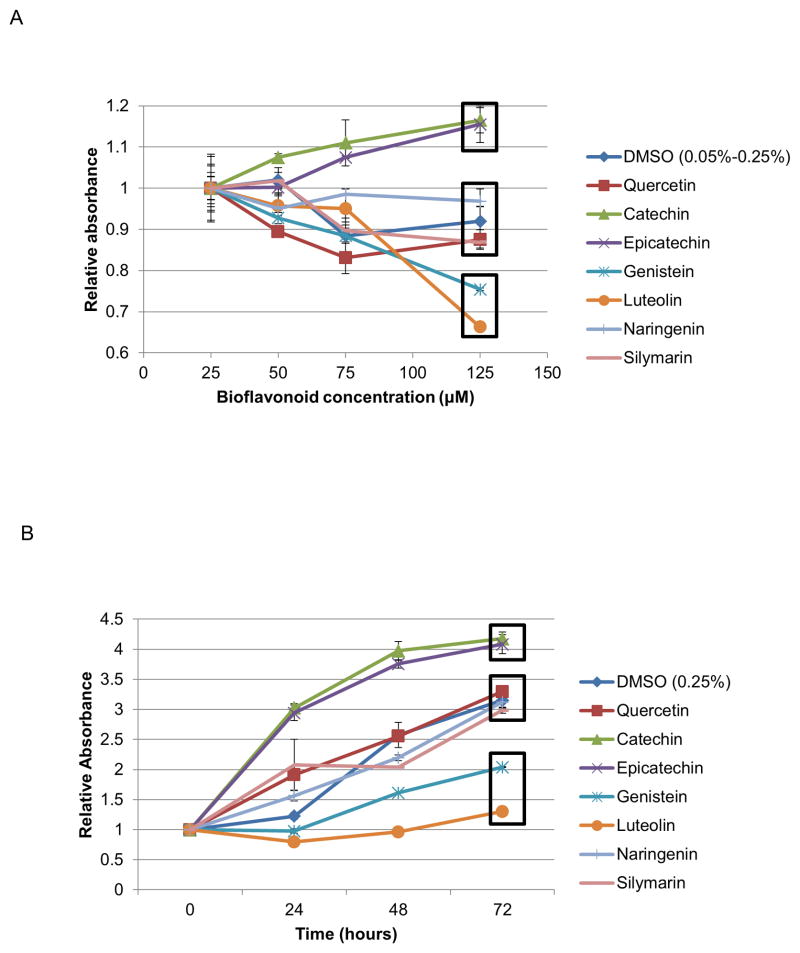
Figure 2.
Cytotoxicity of bioflavonoids as determined by MTT assays A. Bioflavonoid cellular toxicity profile in a concentration range of 25–125μM. MTT assays were performed 72 hours post treatment. B. Bioflavonoid cellular toxicity profile in a time course of 72 hours at 125μM. All data was normalized to time 0. Boxes indicate flavonoids grouped together based on similar toxicity profiles. (Error bars reflect standard deviation.)

