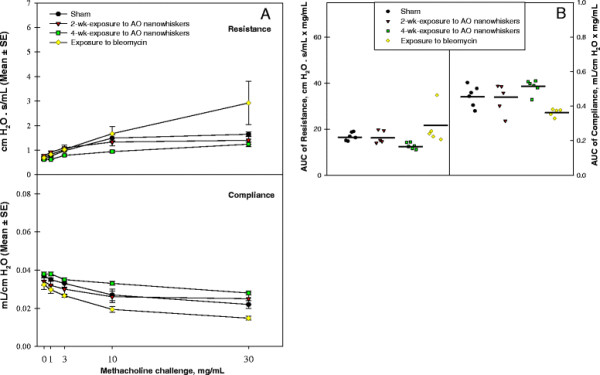
Figure 9.

Measurement of pulmonary mechanics in mice exposed to AO nanowhiskers. Pulmonary mechanics measurements expressed as resistance and compliance in sham- and AO nanowhisker-exposed mice after increasing concentration of methacholine (1, 3, 10 and 30 mg/mL). The mean and SE of resistance and compliance versus methacholine concentrations (A). The individual and mean area under the curve (AUC) versus all increasing methacholine concentrations (B).
