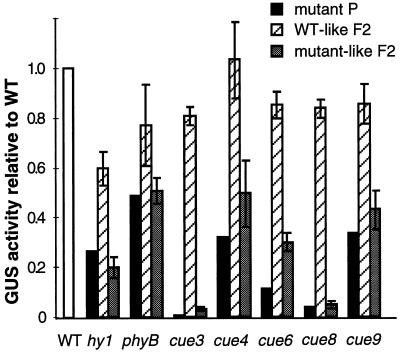
Figure 3.
Cosegregation of the visible and the CAB underexpression phenotypes of each cue mutant. After each mutant was backcrossed, the segregating F2 progeny were scored as mutant or wild type (WT). Three samples of three to five seedlings each were used for GUS measurements. For each mutant values are shown relative to the wild type for the parental line (black bars), wild type-like (striped bars), and visibly mutant (gray bars) F2 seedlings. For phyB, seedlings of intermediate length (presumably heterozygous), not shown here, showed wild-type GUS activities. Error bars = sd.

