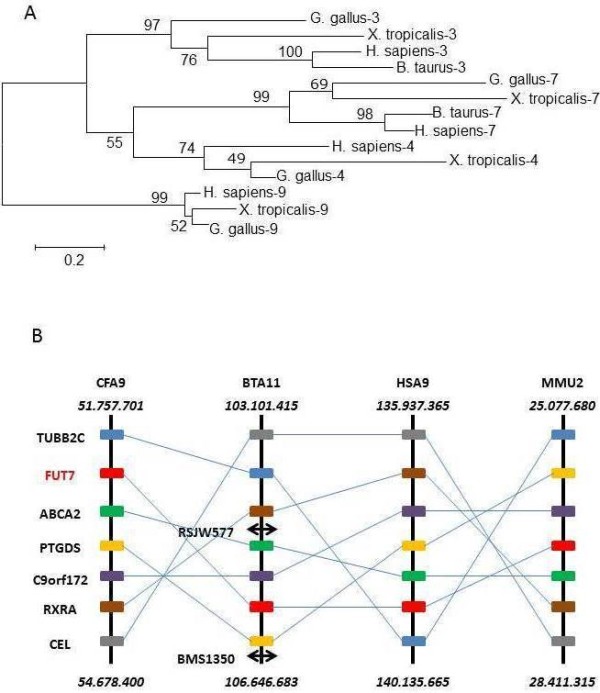
Figure 2.

Position of bovine FUT7 by two independent methods. 2A. Molecular Phylogenetic analysis by Maximum Likelihood method based on the JTT matrix-based model [1]. The tree with the highest log likelihood (−5230.5756) is shown. The percentage of trees in which the associated taxa clustered together is shown next to the branches. A discrete Gamma distribution was used to model evolutionary rate differences among sites (5 categories (+G, parameter = 1.4694)). The rate variation model allowed some sites to be evolutionarily invariable ([+I], 14.8207% sites). The tree is drawn to scale, with branch lengths measured in the number of substitutions per site. 2B. Synteny shared by Canis familiaris, Bos taurus, Homo sapiens, and Mus musculus around FUT7. The positions of the genes (in bp) ending each chromosome segment are indicated above and below. The double arrows correspond to microsatellite markers experimentally determined in BTA11.
