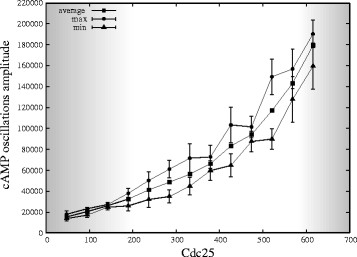
Figure 11.
Diagram of cAMP oscillations amplitude with respect to Cdc25 amount when deleting Pde2. The figure shows the oscillations amplitude of cAMP dynamics resulting from a PSA-1D where the amount of Cdc25 varies in the interval [0, 900], in the condition of deletion of Pde2. The mean and standard deviation of the average (squares), maximum (circles) and minimum (triangles) amount of cAMP during oscillations are plotted. The left and right shady areas correspond to noisy stochastic fluctuations and stable steady states, respectively, while the white area corresponds to oscillatory regimes. Similarly to Figure 10, the analysis highlights that, under the deletion of Pde2, oscillatory regimes in cAMP can be established even when the amount of Cdc25 is at a two-fold overexpression with respect to its physiological amount. Therefore, also the deletion of Pde2 has the effect of changing the range of Cdc25 molecules under which sustained oscillations of cAMP occur.

