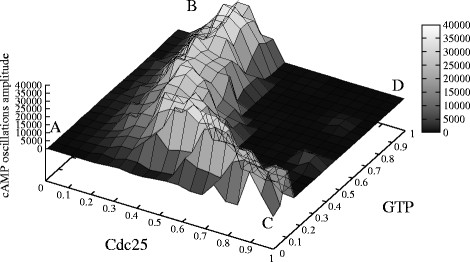
Figure 15.
Influence of the amount of GTP and Cdc25 on the establishment of cAMP oscillatory regimes. The figure shows the oscillations amplitude of cAMP dynamics resulting from a PSA-2D on the values of the initial amounts of GTP and Cdc25, varied in the intervals [1.9×10⁴, 5.0×10⁶] and [0,600], respectively (being GTP = 5.0×10⁶ and Cdc25 = 300 molecules the reference values—see Table 2). In the plot, the values on the x- and y-axis have been normalized in the interval [0, 1]; a total of 200 initial conditions were sampled from the specified bidimensional parameters space. This analysis shows that when the amount of Cdc25 is approximately at normal condition or slightly lower, oscillatory regimes are established for basically any value of GTP (from point A to point B), being the amplitude of oscillations smaller in lower nutrient availability conditions. On the contrary, when the amount of Cdc25 increases, no oscillations of cAMP occur when GTP is high (point D), but oscillatory regimes are still present if GTP is low (point C).

