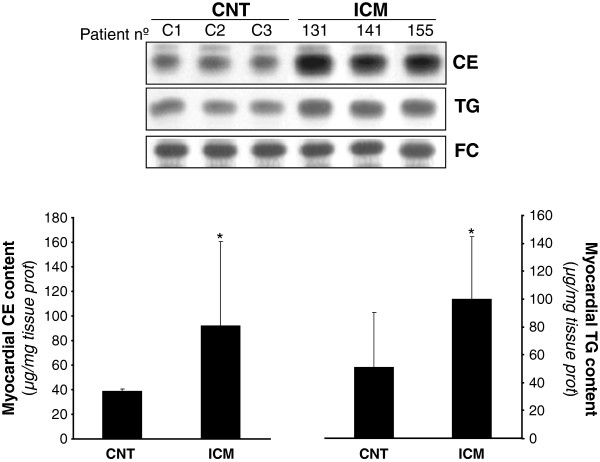
Figure 7.
Myocardial cholesteryl ester (CE), triglyceride (TG) and free cholesterol content (FC) in controls and ICM hearts. Representative thin layer chromatography showing CE, TG and FC bands in three control and three ICM patients, and bar graphs showing the mean ± SD of myocardial colesteryl ester and triglyceride bands in CNT (n = 8) and ICM (n = 18) groups. CNT, controls; ICM, ischemic cardiomyopathy. Results are expressed as micrograms per mg of tissue.

