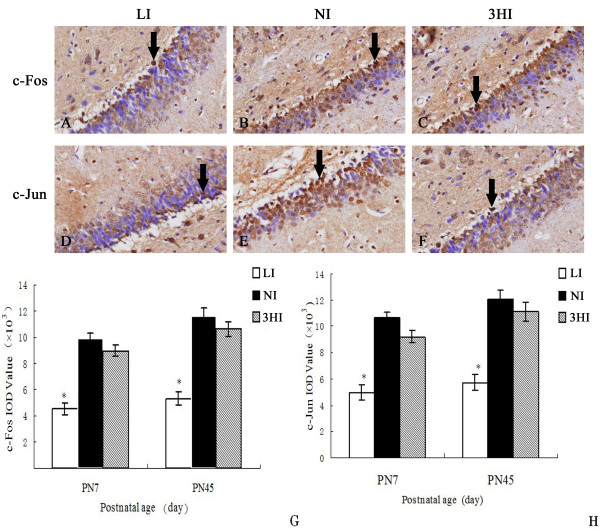
Figure 1.
Expression of c-Fos and c-Jun in the hippocampal CA1 area of pups on PN7 and PN45. Upper three photomicrographs (A-C) show the expression of c-Fos in the CA1 of the LI (A), NI (B), and 3HI (C) groups. Lower three photomicrographs (D-F) show the expression of c-Jun in the CA1 of the LI (D), NI (E), and 3HI (F) groups. G and H represent the IOD values of c-Fos and c-Jun expressions in CA1 on PN7 and PN45, respectively. Data are expressed as the mean ± SEM (n = 6, for each group). * P < 0.05 compared with the NI control group on the same day.

