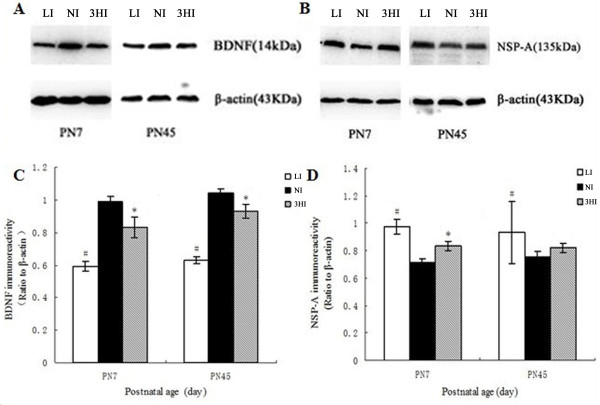
Figure 2.
Protein expression levels of BDNF and NSP-A in the pup hippocampus on PN7 and PN45. A and B: protein levels determined via Western blot. C and D: Ratios of NSP-A/β-actin and BDNF/β-actin immunoreactive densities were determined for each group. The expression of the two proteins was normalized to β-actin. The height of each bar represents the mean ± SEM (n = 6 for each group). * P < 0.05 compared with the NI group on the same day; #P < 0.01 compared with the NI group on the same day.

