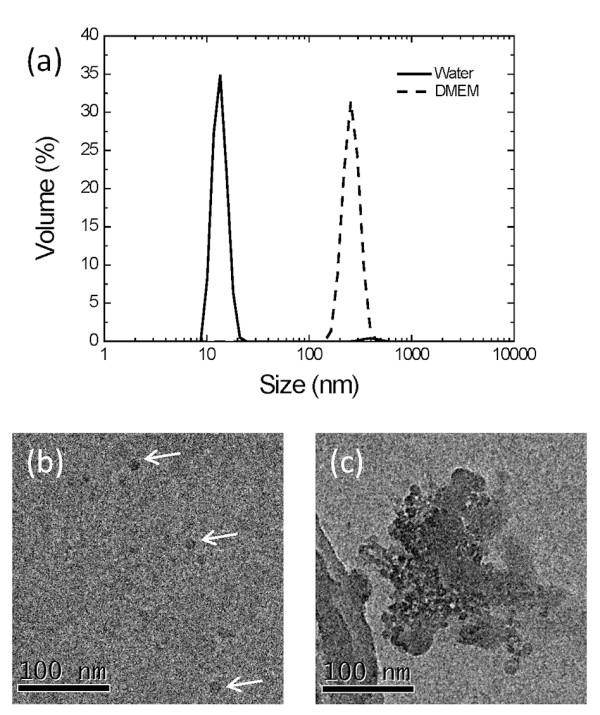
Figure 1.

(a) Dynamic light scattering measurements of silica NP (100 μg/ml) size distributions in MilliQ water (solid line) and DMEM (dashed line) at 37°C. (b,c) TEM images of silica NPs (100 μg/ml) suspended in (b) Milli-Q water and (c) DMEM. Due to the relatively low electron density of SiO2 the TEM images of the dispersed silica NPs have low contrast (b) so for clarity, three isolated NPs are identified with arrows.
