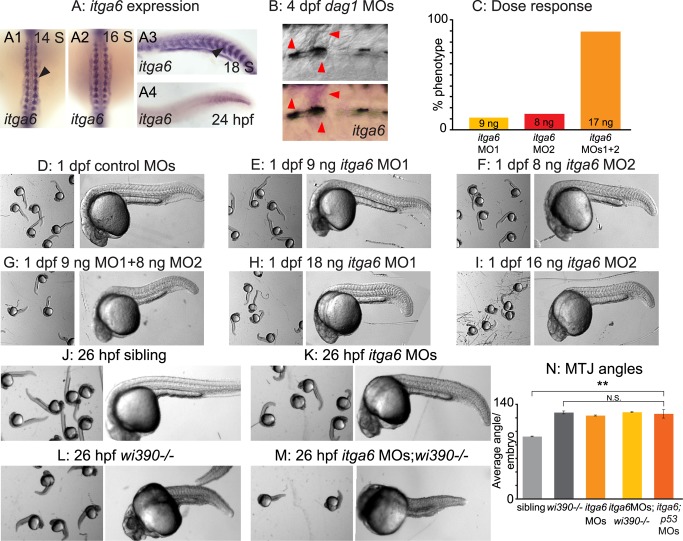
Figure 4. itga6 is upregulated in regenerating muscle and characterization of itga6 MOs.
(A) In situ hybridizations showing itga6 expression (purple). (A1–2) Dorsal view, anterior top. (A3–4, B) Side view, anterior left, dorsal top. (A1–4) Black arrowheads denote somitic expression. itga6 expression is high during early muscle development, then decreases. (B) itga6 is re-expressed in regenerating muscle. itga6, not normally expressed in muscle at 4 dpf, is observed in dystrophic lesions of 4 dpf dag1 morphants (red arrowheads). (C) itga6 MO characterization. Dose response graph. MO1 and MO2 generate the same phenotype and synergize when co-injected. (D–M) Brightfield images, side view, anterior left, dorsal top, 1 dpf embryos. (D–I) Phenotypic analysis of itga6 MOs 1 and 2. Embryos injected with low doses of MO1 (E) or MO2 (F) are morphologically similar to controls (D). Combining the two lower doses of MOs 1 and 2 results in a truncated body axis with myotomes that are narrower in the anterior-posterior dimension (G). The identical phenotype is obtained when higher doses of either MO1 (H) or MO2 (I) are injected. (J–M) Pseudo-genetic epistasis analysis. (J) Siblings, (K) itga6 morphants, (L) wi390−/−/laminin gamma1 mutants, and (M) itga6 MOs;wi390−/−. Note that injection of itga6 MOs into laminin mutants does not change their phenotype, suggesting Itga6 functions in laminin signaling and adhesion. (N) Average MTJ angles of 1 dpf embryos. MTJ angles in morphants, mutants, and morphant/mutants do not significantly differ from one another and are all significantly wider than in sibling controls; **p<0.01; N.S., not significant.

