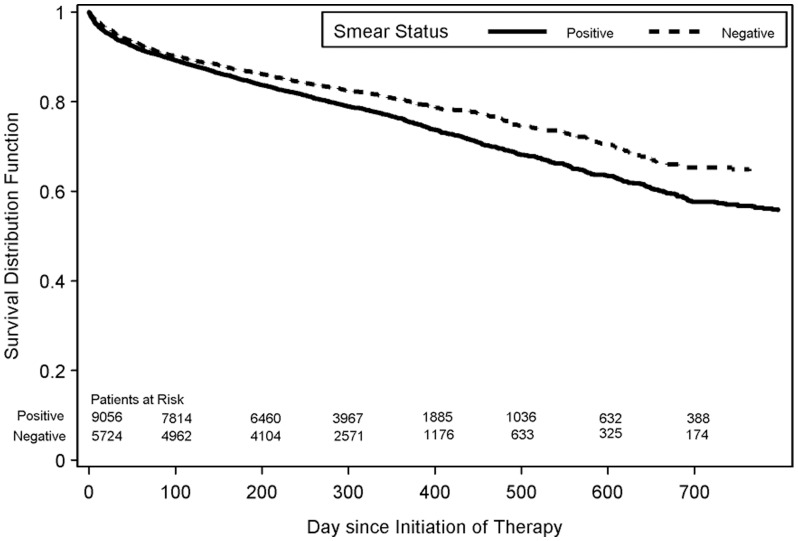
Figure 2. Survival Curves for patients with HIV-infection and culture-confirmed pulmonary TB, by sputum smear result, United States, 1993–2006.
Solid line indicates the Kaplan-Meier survival curve for smear-positive patients. Dotted line indicates the Kaplan-Meier survival curve for smear-negative patients.

