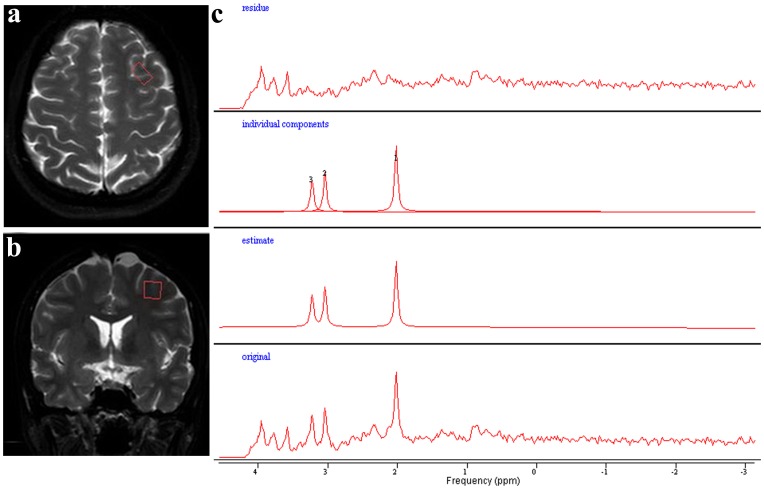
Figure 1. MRS data acquisition and post-processing.
(a) and (b) are the transversal and sagittal view of the brain, respectively. The red rectangles indicate the volume of interest representing the left dorsolateral prefrontal cortex (DLPFC) from where the spectrum (c) is acquired. (c) is the spectrum of the left DLPFC. From bottom to the top are the original spectrum, the estimated spectrum yielded by ‘Advanced Method for Accurate, Robust and Efficient Spectral fitting (AMARES)’ package, the individual peak components and the residual spectrum.

