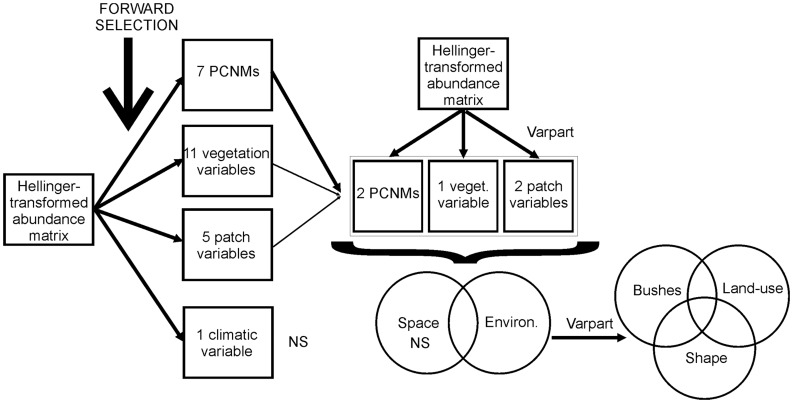
Figure 2. Diagram of the statistical steps.
Diagram of the different data sets used and the analytical steps performed with respect to the four predictor data matrices. Varpart = variation partitioning. NS = not significant. PCNM = principal coordinates of neighbor matrices. Analysis initiated by performing a selection of variables from each data matrix. The selected variables were grouped in a unique data matrix, which was subjected to a variation partitioning method to separate the influence of space and environment. Finally, the environmental and spatially structured environmental portion of variation was subjected to the variation partitioning to separate the unique and joint effects of environmental variables on metacommunity structure.

