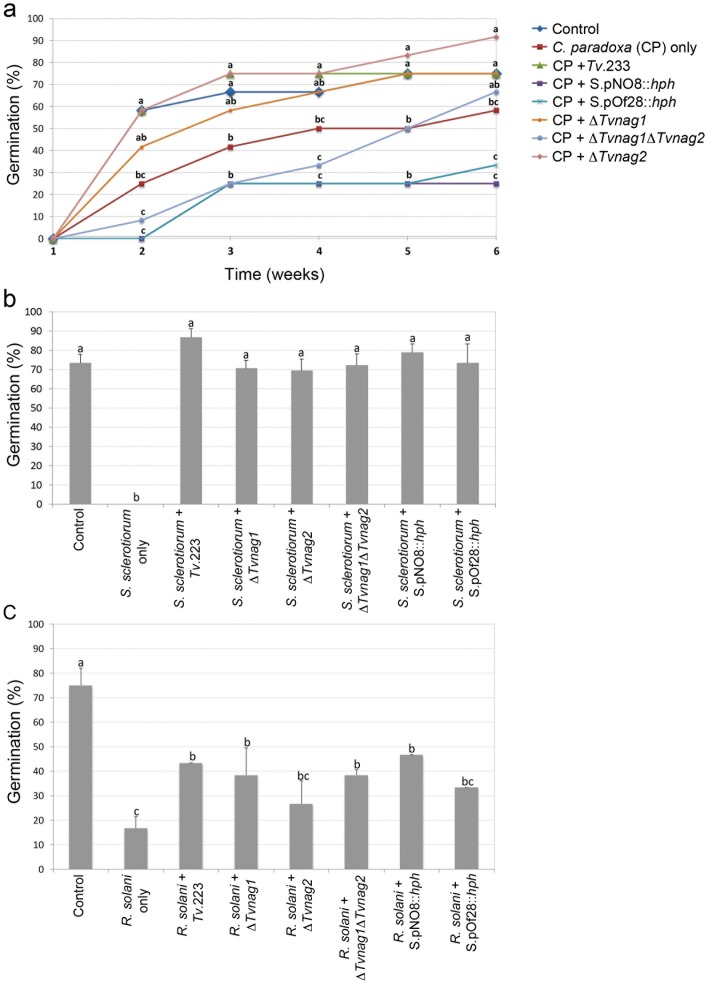
Figure 5. Biological control of soil-borne pathogens.
(a) Biocontrol of pineapple disease of sugarcane caused by the soil-borne pathogen Ceratocystis paradoxa. Germination of sugarcane setts was determined in compost infested with the pathogen C. paradoxa and in mixed-species microcosms containing the pathogen and chitinase-deficient mutants. Percentage germination was measured weekly, over a 6 week period. The control consisted of sugarcane setts planted in uninfested compost. Each point is the mean of twelve replicates and percentages were converted to arc sin−1 values for statistical analysis by t-test. Points with different letters are significantly different at 95% confidence level, considering each week separately. (b) Biocontrol of pre-emergence damping-off disease of lettuce caused by the pathogen Sclerotinia sclerotiorum, Germination of lettuce seeds was determined in peat-based microcosms infested with the pathogen S. sclerotiorum and in mixed-species microcosms containing the pathogen and chitinase-deficient mutants. Percentage germination was measured 10 days after sowing. The control consisted of lettuce seeds planted in uninfested peat. Each point is the mean of three replicates (each consisting of 25 lettuce seed) and percentages were converted to arc sin−1 values for statistical analysis by Tukey test for comparison of means. Histograms with different letters are significantly different at 99% confidence level. (c) Biocontrol of bean rot caused by the pathogen Rhizoctonia solani. Germination of bean seeds was determined in compost infested with the pathogen R. solani and in mixed-species microcosms containing the pathogen and chitinase-deficient mutants. Percentage germination was measured 20 days after sowing. The control consisted of bean seeds planted in uninfested compost. Each point is the mean of six replicates and percentages were converted to arc sin−1 values for statistical analysis by Tukey test for comparison of means. Histograms with different letters are significantly different at 95% confidence level.

