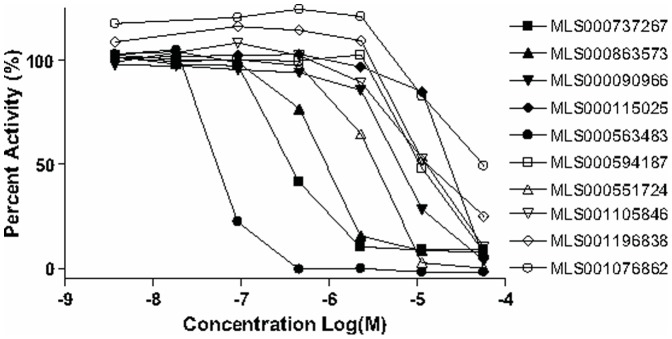
Figure 2. Representative curves observed from 10 screening hits chosen to demonstrate the range of potencies observed in the concentration-response-based screen.
Structures and additional data associated with these hits are presented within Figure 7.

