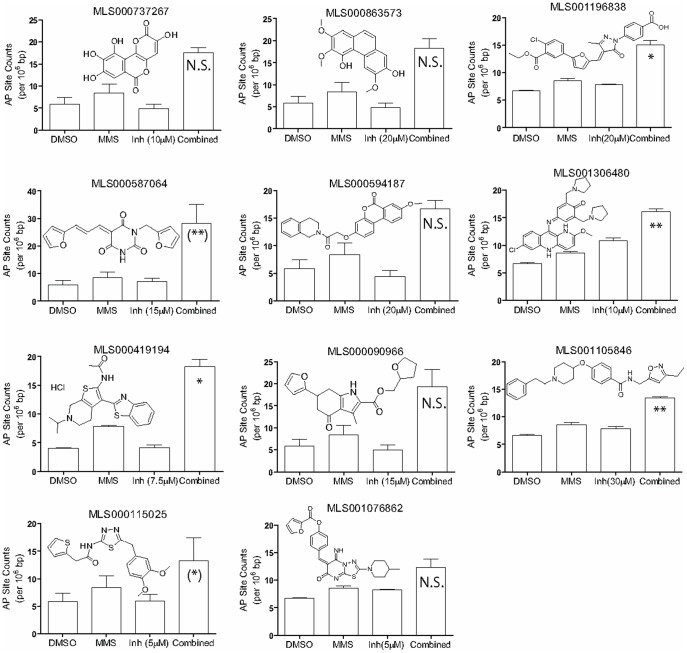
Figure 8. AP-site accumulation.
HeLa cells were exposed to each compound shown in the absence and presence of 275 µM MMS, and total genomic AP sites were measured as described in Methods. The number of AP sites per 106 base pairs of genomic DNA are presented as the average and standard deviation of two independent measurements. P-values (*P<0.05, **P<0.01) were calculated to evaluate the significance of the enhancement of AP site levels produced by the combined treatment versus MMS alone. N.S., not significant (P≥0.05); P-value designations for MLS000587064 and MLS000115025 shown in parentheses are derived from the repeat testing reported in Figure S1.

