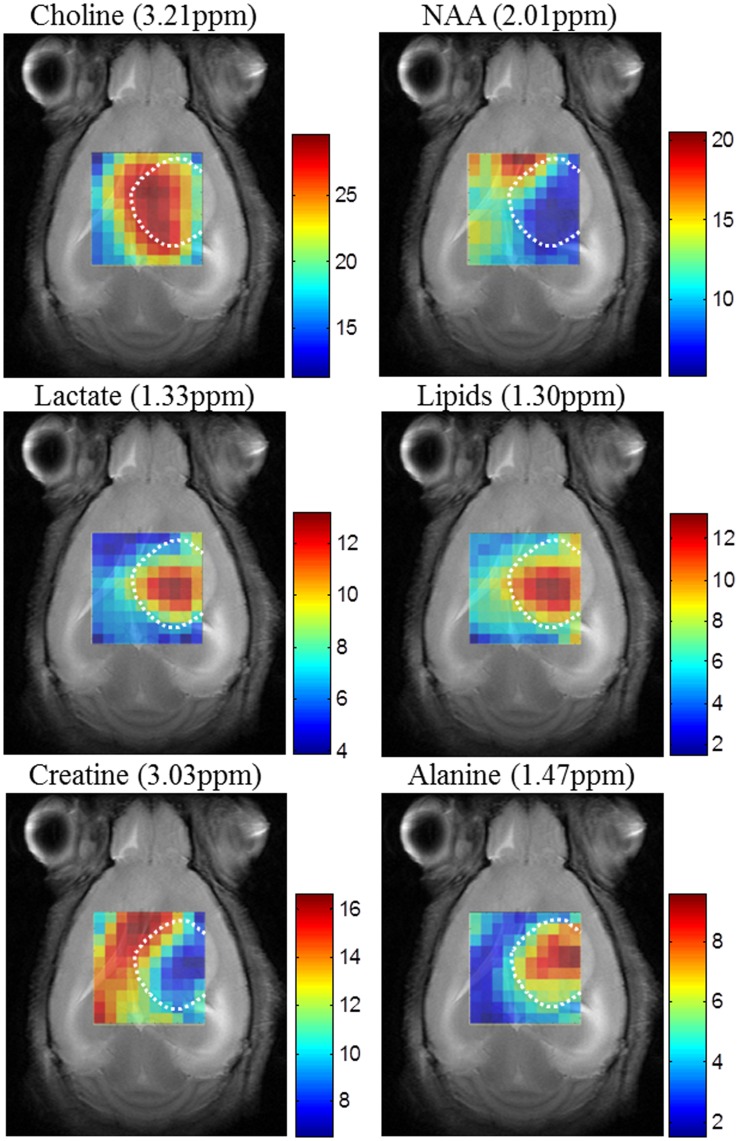
Figure 1. Peak maps of principal metabolites for mouse C69, harboring a glioblastoma.
It was scanned at 7 Tesla by PRESS-MRSI with 136 ms echo-time. MRSI data were acquired with Bruker ParaVision 4.0, and Fourier interpolated to 32×32 voxels, with a final PRESS MRSI data grid of 10×10 voxels. Line broadening adjustments and zero order phase correction were carried out. Then, the data were fed into a home-built module for MRSI post-processing, where the 4.5–0 ppm region of each spectrum was individually normalized to Unit Length (UL2). Each map shows the peak height in absolute values of the studied metabolite in each voxel. The white dotted lines highlight the tumoral mass according to T2-W MR images. The scales reflected in the colors coding are in arbitrary units.

