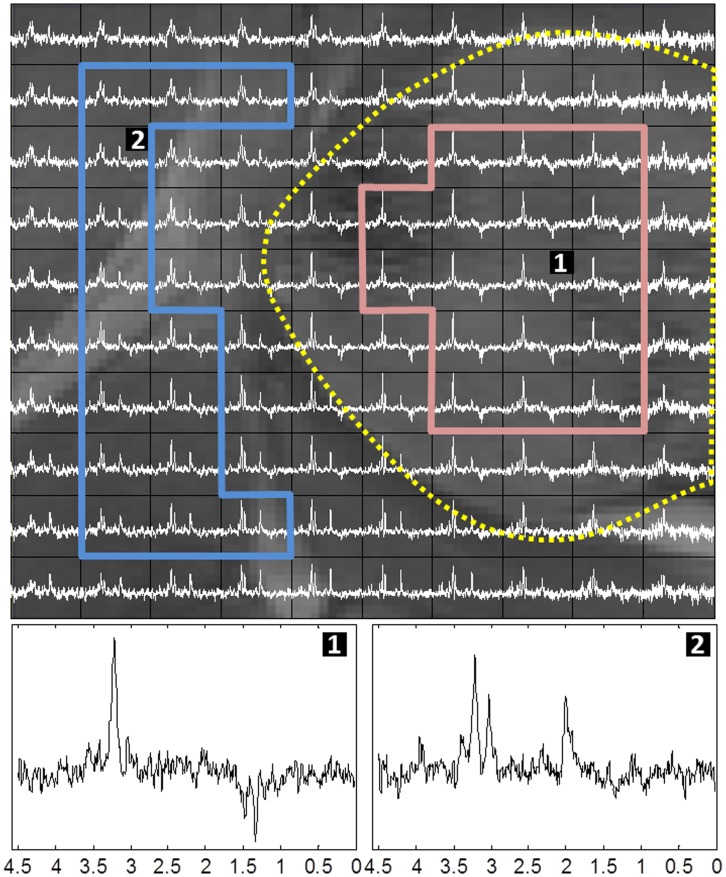
Figure 6. VOI region of mouse C69.
T2-W image enlarged and overlaid with the MRSI matrix at LTE; spectra shown in white. The red and blue contours delineate, in turn, characteristic tumor and non-tumor areas used for calculating the average spectra to which the unsupervised sources were compared. The yellow dotted line outlines the tumor as judged from the “anomaly region” on the reference T2-W image. Bottom spectra 1 and 2 arise, enlarged, from the voxels labeled in the top image.

