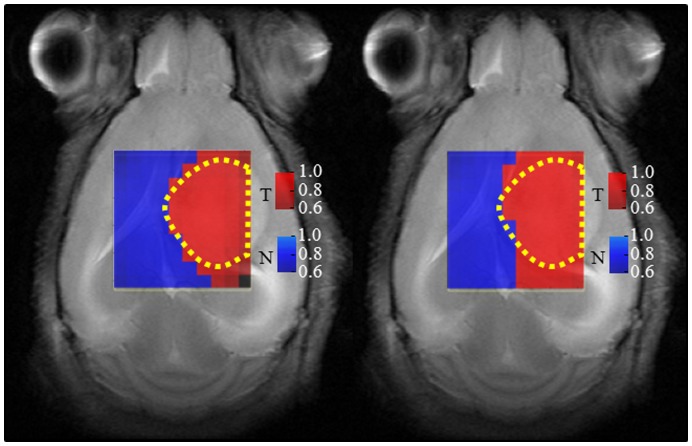
Figure 7. Source-based labels maps generated for mouse C69.
The maps obtained at LTE (left) and STE (right) are superimposed to the T2-W reference image. The red color identifies tumor (T), blue identifies non-tumor (N), and black represents ‘undecided’. The color intensities shown in the scale bar on the right hand side correspond to the magnitude of the correlation values between the spectra of the voxels and their representing source. The yellow dotted lines outline the tumor region, as judged from the T2-W image, similar to figure 6.

