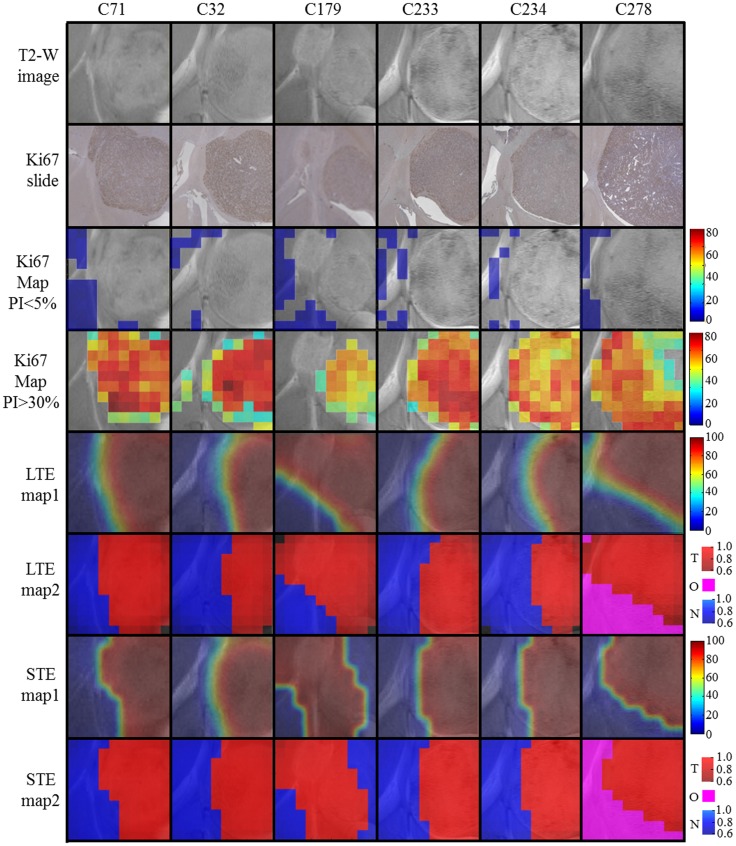
Figure 9. Summary of the results for mice C71, C32, C179, C233, C234, and C278.
T2-W images (first row), Ki67 slides (second row), Ki67 maps with PI≤5% (third row), Ki67 maps with PI>30% (fourth row), source contributions maps (interpolated) of the tumoral source calculated at LTE (fifth row), and STE (seventh row), source-based labels maps calculated at LTE (sixth row) and STE (eighth row). Color columns of rows 3 and 4 as in figure 5. Color columns of rows 5 and 7 as in figure 8. Color columns of rows 6 and 8 similar to figure 7, adding a new color (magenta) to represent the region below the main tumor source 50% threshold (O, “other”) in mouse C278. Please note that C278 does not contain non-tumoral tissue voxels that fulfill the labeling criteria for source calculation according to [32], [33].

