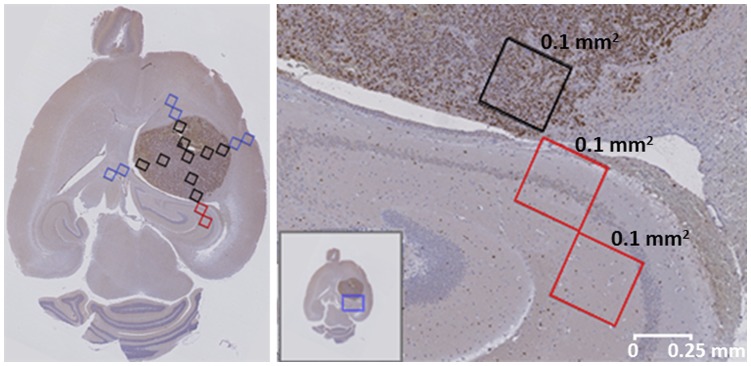
Figure 10. Ki67 preparation from mouse C69.
On the left hand side, 0.1 mm2 manual sampling areas (colored rectangles) for positive Ki67 cells’ evaluation (brown spots): black squares, sampling inside the tumor mass; blue squares, samplings adjacent to tumor mass; red squares, Cornu Ammonis samplings adjacent to tumor mass, shown enlarged on the right. On the right hand side, rectangles from top to bottom: PI was 57, 13 and 13.3%; the first square was inside the tumor mass, the second one was adjacent to it, and the third one was outside the tumor. Cellularity was 5100, 1200 and 750 cells/mm2, respectively. Non-proliferating nuclei were stained in blue and proliferating nuclei in brown. The small insert in the right image (blue square) shows the location of the enlarged image with respect to the whole brain. The white bar at the bottom-right shows scale.

