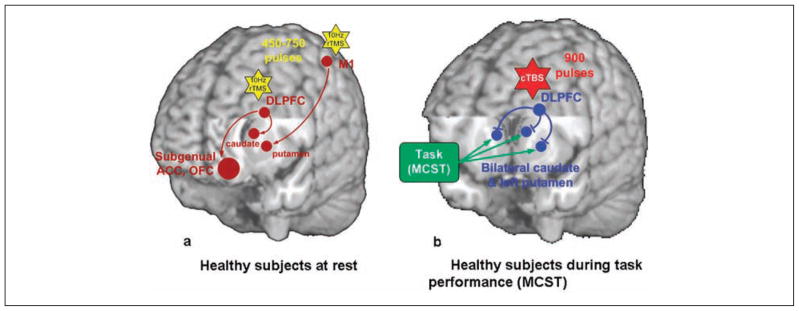
Figure 3.
Schematic diagrams of the dopaminergic effect of repetitive transcranial magnetic stimulation (rTMS). (a) In healthy subjects at rest, 10-Hz rTMS over the left dorsolateral prefrontal cortex (DLPFC) increased dopamine (DA) release in the ipsilateral caudate nucleus (Strafella and others 2001), anterior cingulate cortex (ACC), and medial orbitofrontal cortex (OFC; Cho and Strafella 2009), whereas M1 stimulation increased DA release in the ipsilateral putamen (Strafella and others 2003). The yellow stars represent the 10-Hz rTMS. The brown circles and arrows represent the stimulated site (i.e., DLPFC and M1) and increased DA release. (b) During task performance, continuous theta burst stimulation (cTBS) applied over the left DLPFC impaired task performance and disrupted striatal DA release in the bilateral striatum (Ko, Monchi, Ptito, Bloomfield, and others 2008). In contrast, right DLPFC stimulation during the same task had no significant effect. The green box and arrows represent the effect of performing the Montreal card sorting task (MCST), which is shown to increase DA release in the striatum (Monchi, Ko, and others 2006). The red star represents cTBS. The blue circles and arrows represent the stimulated site (i.e., DLPFC) and decreased DA release.

