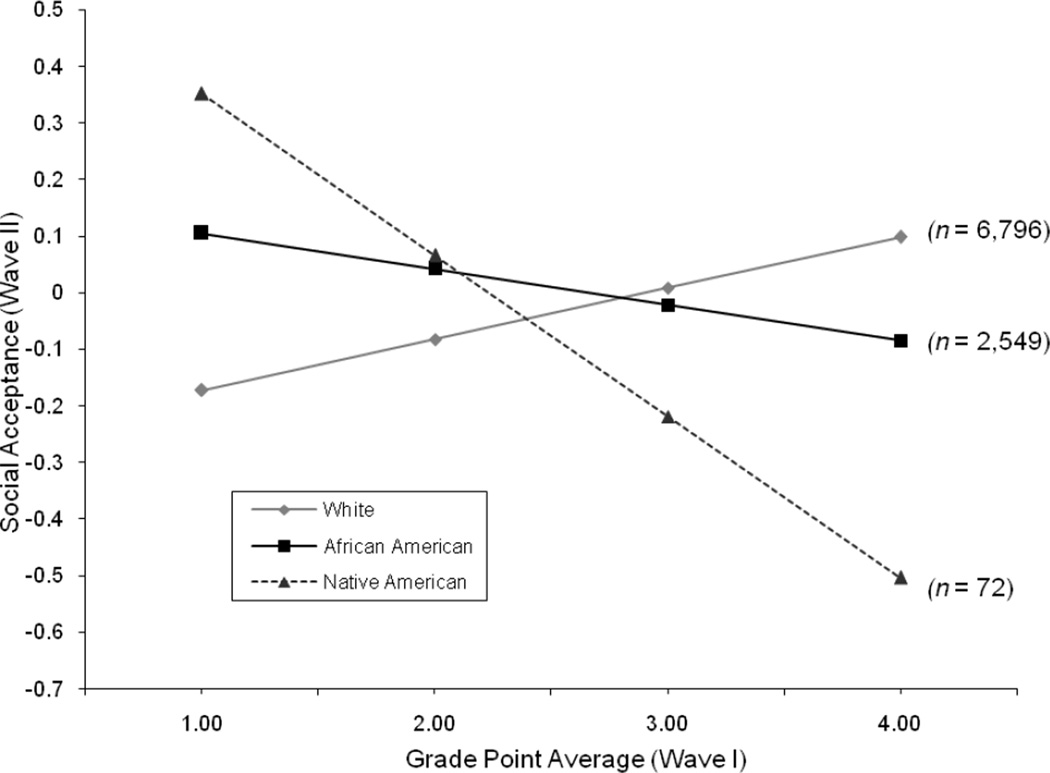
Figure 1.
Fitted interaction plot depicting the relationship between Wave I GPA and Wave II social acceptance for Black, Native American, and White adolescents. Note. This figure is based on parameter estimates from model 2 (Table 4), with GPA converted back to its original four point scale.

