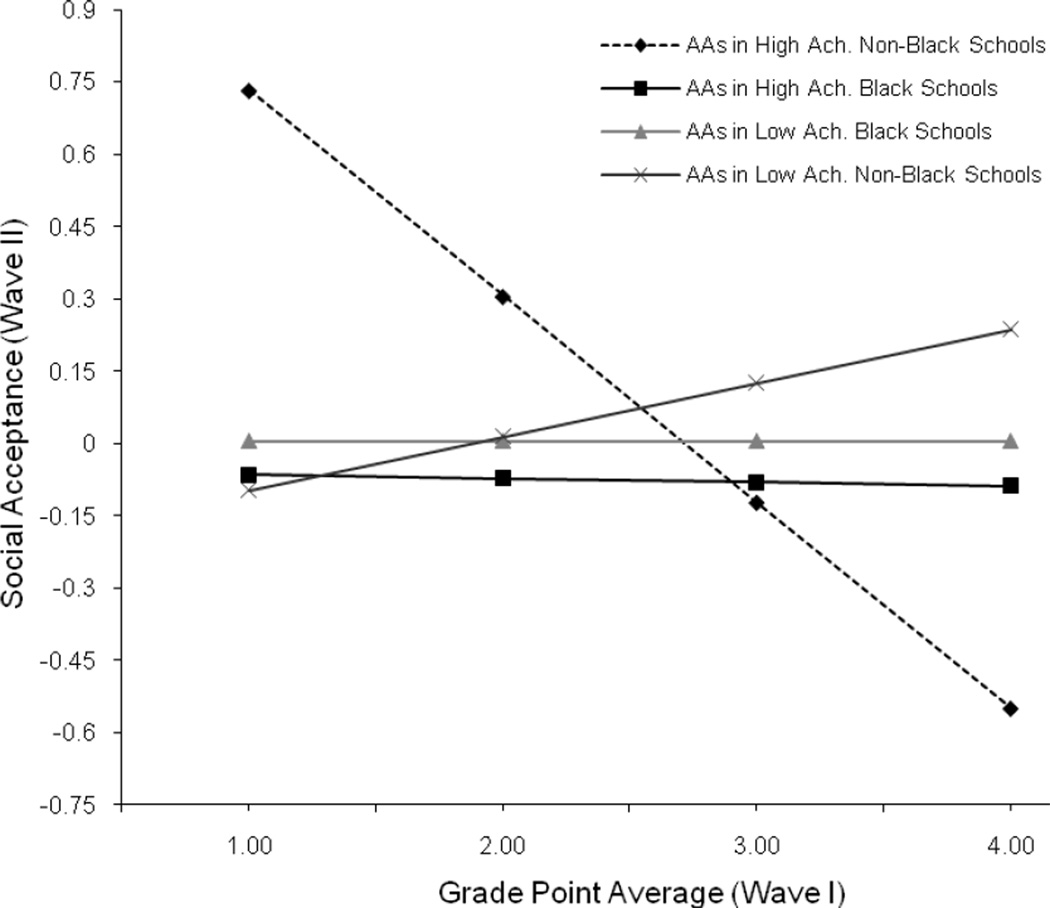
Figure 2.
Fitted interaction plot depicting the relationship between Wave I GPA and Wave II social acceptance for Black adolescents in four school contexts. Note. This figure is based on parameter estimates from model 9 (Table 5), with GPA converted back to its original four point scale. Sixty eight percent of Black students (n = 1,708) are in Black schools (top quartile of percent Black), and 32% percent (n = 801) are in less Black schools. Since school-level achievement is a continuous variable, specific sample sizes cannot be associated with each of the lines: High achieving school = +1 SD from mean, Low achieving school = −1 SD from mean. AAs = African Americans.

