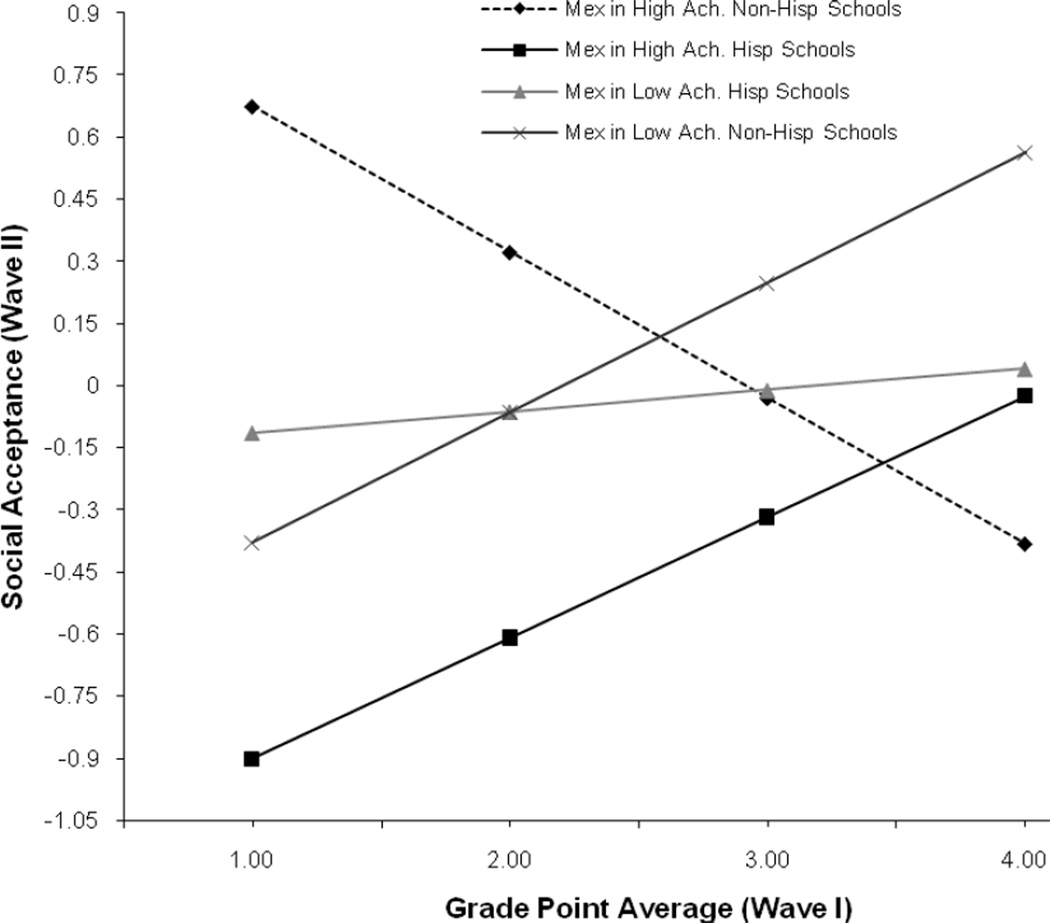
Figure 3.
Fitted interaction plot depicting the relationship between Wave I GPA and Wave II social acceptance for adolescents from Mexican decent in four school contexts. Note. This figure is based on parameter estimates from model 15 (Table 6), with GPA converted back to its original four point scale. Seventy seven percent of Mexican students (n = 689) are in Hispanic schools (top quartile of percent Hispanic), and 23% percent (n = 207) are in less Hispanic schools. Since school-level achievement is a continuous variable, specific sample sizes cannot be associated with each of the lines: High achieving school = +1 SD from mean, Low achieving school = −1 SD from mean. Mex = Adolescents from Mexican decent.

