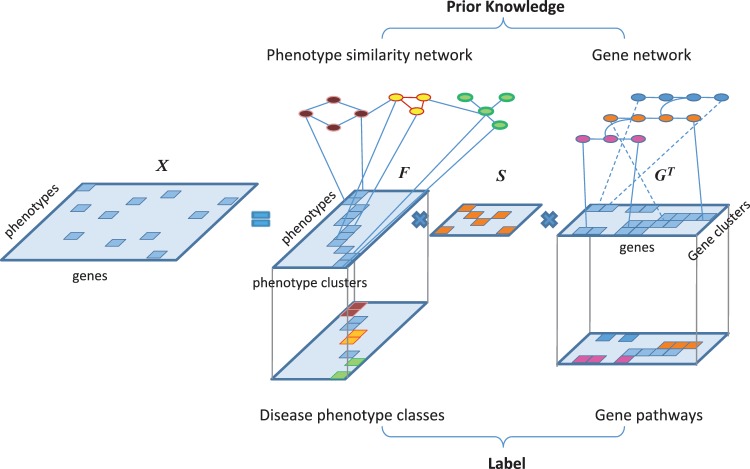
Figure 1.
NMTF of disease phenotype–gene associations. The phenotype–gene association matrix X is factorized into products of three matrices, phenotype cluster membership F, gene cluster membership G and phenotype cluster–gene cluster association S for supervised co-clustering of phenotypes and genes. Label information for the disease classes and the pathways are available for a small number of phenotypes and genes. Prior knowledge is also introduced from phenotype similarity network and gene network. For better visualization, different colors are used to distinguish the phenotypes and the genes in different clusters.

