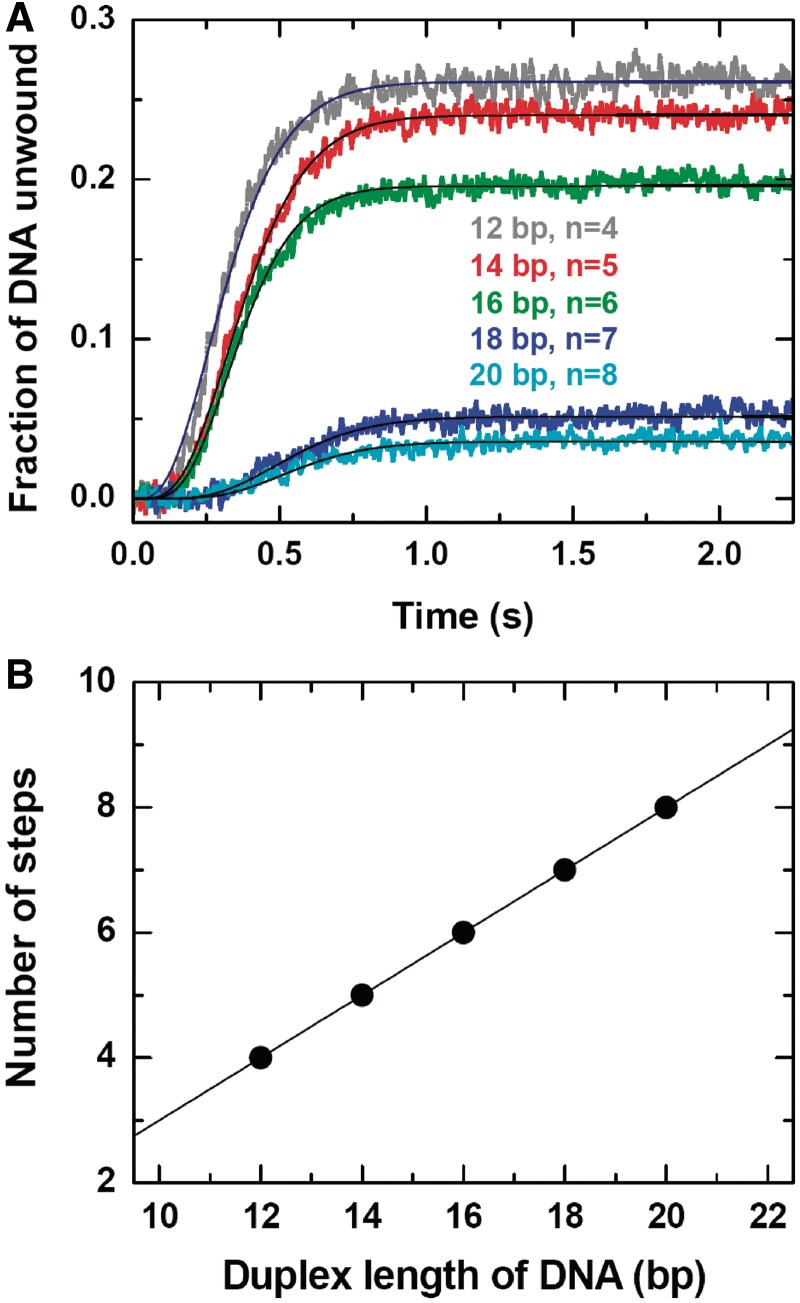
Figure 8.
Unwinding of a 15-nt 3′-tailed DNA with varying duplex lengths. The measurements were performed under the same conditions as in Figure 4 except for that the ATP concentration was fixed at 1 mM. (A) Kinetic time courses. The solid lines are best fits of the data to Equation (1) with n = 4, 5, 6, 7 and 8 for the five data curves, respectively, with the corresponding values of kobs as 11.7 ± 0.1, 12.5 ± 0.1, 15.5 ± 0.1, 12.0 ± 0.2 and 13.6 ± 0.2 s−1. (B) Number of steps for unwinding the different duplexes. The straight line was a straight line with a slope of 0.5 bp−1, corresponding to a step size of 2 bp.

