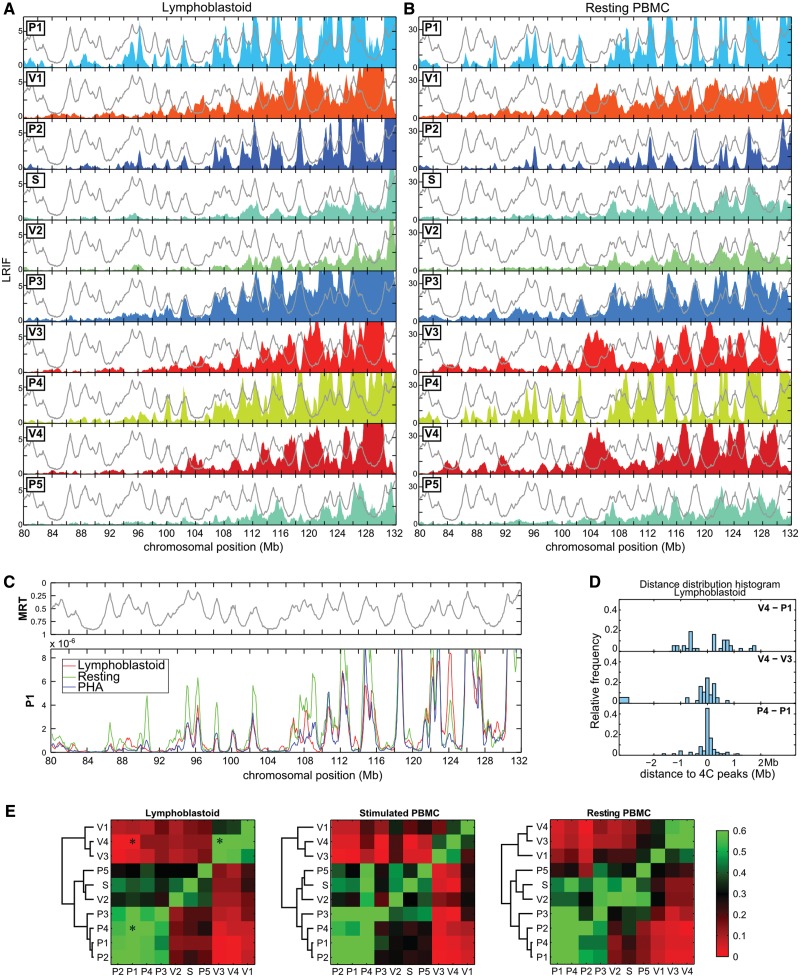
Figure 2.
Chromosomal domains with opposite replication timing segregate in the nuclear space. (A) LRIF in lymphoblastoid cells for the 10 viewpoints (see text and Materials and Methods’ section for the definitions). The colored filled curves correspond to the 4C profiles in a region of chromosome 5 centered ∼60 Mb upstream of the viewpoints. The light gray lines correspond to the replication timing in lymphoblastoid cells (11) plotted with the same y-axis as in Figure 1A. (B) Similar analysis performed with resting PBMC. (C) Comparison of LRIF values of the P1 viewpoint in lymphoblastoid cells (red), resting PBMC (green) and PHA-stimulated PBMC (blue). LRIF values have been normalized for differences in read numbers. The upper panel corresponds to the replication timing in lymphoblastoid cells. (D) Distribution of distances between the 4C peaks detected in the LRIF profiles. We detected the 4C peaks and measured the distances between each of them and the closest 4C peak obtained with another viewpoint. All pairwise distances were measured over the whole chromosome 5. Three distance distribution histograms are shown here as examples (V4–P1, V4–V3 and P4–P1). A distribution centered on zero (as P4–P1) indicates that the LRIF maxima of the two viewpoints overlap. (E) To quantify the similarities between LRIF signals from different viewpoints, we calculated the percentage of occurrences where the pairwise distances measured in (D) are <250 kb. This percentage was encoded with a green–red color map. Similar signals are green (V4/V3 and P4/P1), whereas out of phase signals are red (V4/P1). The asterisks correspond to the distribution histograms shown in (D).

